
Figure 3.
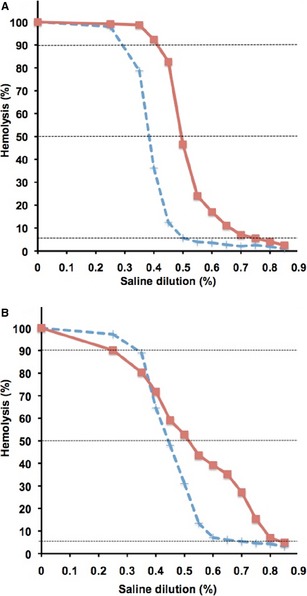
Result curves of Osmotic fragility tests (A) DAT+ ( ) and DAT‐ (
 ) control dog. Note right‐shifted curve for DAT+ dog. (B) Note right‐shifted and flattened curve, same as above.
Official websites use .gov
A
.gov website belongs to an official
government organization in the United States.
Secure .gov websites use HTTPS
A lock (
) or https:// means you've safely
connected to the .gov website. Share sensitive
information only on official, secure websites.
Result curves of Osmotic fragility tests (A) DAT+ () and DAT‐ () control dog. Note right‐shifted curve for DAT+ dog. (B) Note right‐shifted and flattened curve, same as above.