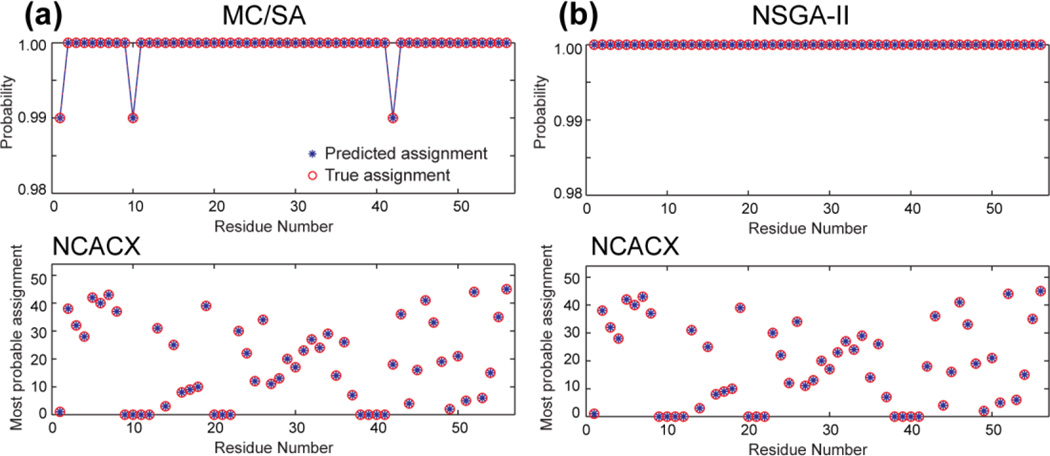
Figure 4.
Resonance assignment of GB1 with consecutive deletion of 20% of the peaks. Only the NCACX assignment is shown; the NCOCX prediction is similar. (a) MC/SA generated 100 valid results containing 2 distinct solutions. (b) Modified NSGA-II produced a single Paratoorder- 1 solution. The top panels show the probability of the top assignment of each residue, and the bottom panels show the peak number of the most probable assignment. The probability and peak number of the predicted assignment (blue stars) are compared with those of the true assignment (red circles). Note the y-axis scale of the probabilities covers a very small range of 98–100%, indicating that both algorithms have very high assignment probabilities, and both methods are 100% accurate in the most probable predictions.

