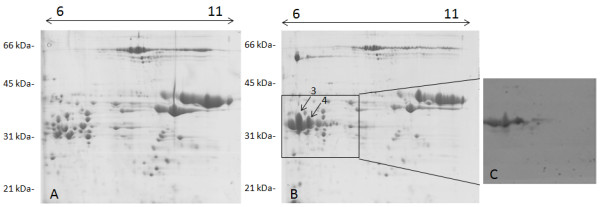
Figure 4.

Comparison between the 2D electrophoretic patterns of glutenin subunits of the B1133-WT transgenic lines. A) null segregant control line; B) genotype expressing the B1133-WT gene; C) Immunoblotting performed by using the anti-FLAG antibody on the gel region is indicated by the box in B). Arrows point at the two proteins (spots nr. 3 and 4) that are absent in the control line. Molecular weight standards (in kDa) are reported on the left side, and the pI range is indicated at the top of the gels.
