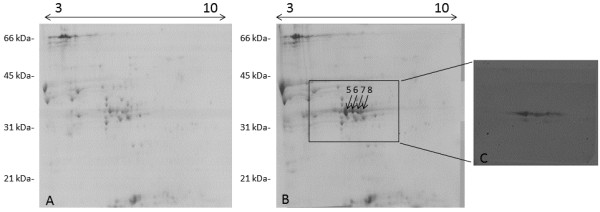
Figure 6.

Comparison between the 2D electrophoretic patterns of glutenin subunits of the B1133-T23N transgenic lines. A) null segregant control line; B) genotype expressing the B1133-T23N gene; C) Immunoblotting performed by using the anti-FLAG antibody on the gel region indicated by the box in B). Arrows point at the four proteins (spots nr. 5-8) that are absent in the control line. Molecular weight standards (in kDa) are reported on the left side, and the pI range is indicated at the top of the gels.
