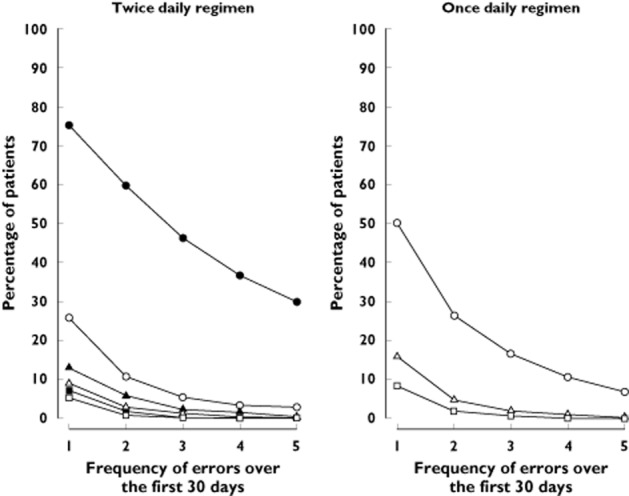
Figure 2.

Frequency of dosing errors based on dosing intervals.  , >18 h;
  , >30 h;
  , >42 h;
  , >54 h;
  , >56 h;
  >66 h;
  , >78 h. Lines show the frequency at which patients miss one or more twice daily or once daily doses, presented as specified intervals of time between doses (e.g. an interval of >18 h corresponds to missing one twice daily dose; an interval of >30 h corresponds to missing two consecutive twice daily doses or one once daily dose)
