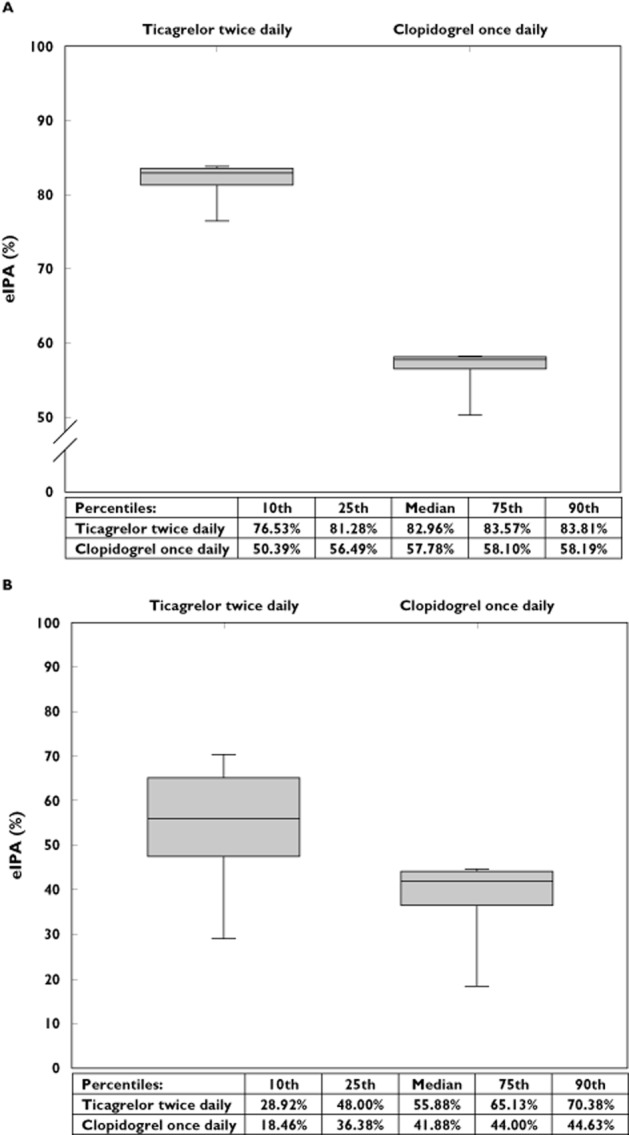
Figure 3.

The twice dailyadvantage.(A) Box whisker plot of the mean eIPA between patients for both regimens. The central box represents the 25th to 75th percentile; the middle line represents the median. The ends of the whiskers represent the 10th and 90th percentile of the distribution. (B) The box whisker plot represents the minimum eIPA value of the eIPA trajectory projection over 30 days of each patient. The central box represents the 25th to 75th percentile; the middle line represents the median. The ends of the whiskers represent the 10th and 90th percentile of the distribution. eIPA = estimated inhibition of platelet aggregation
