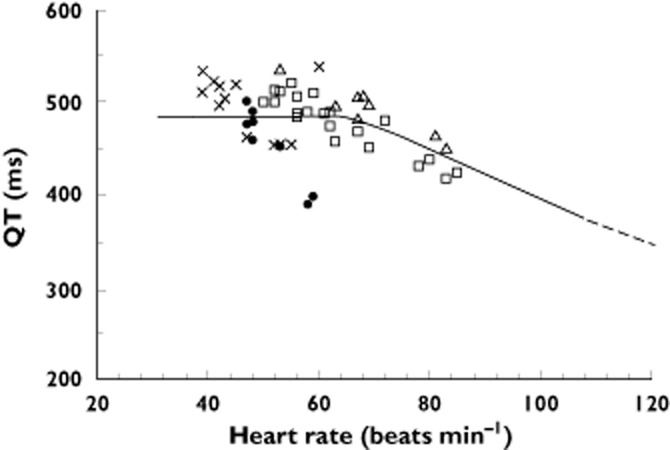
Figure 2.

Plot of the QT interval vs. heart rate for the four patients with an abnormal QT interval (see Table 1).  , 52M patients;
  , 41M patient;
  , 25M patient;
  , 17F patient

Plot of the QT interval vs. heart rate for the four patients with an abnormal QT interval (see Table 1).  , 52M patients;
  , 41M patient;
  , 25M patient;
  , 17F patient