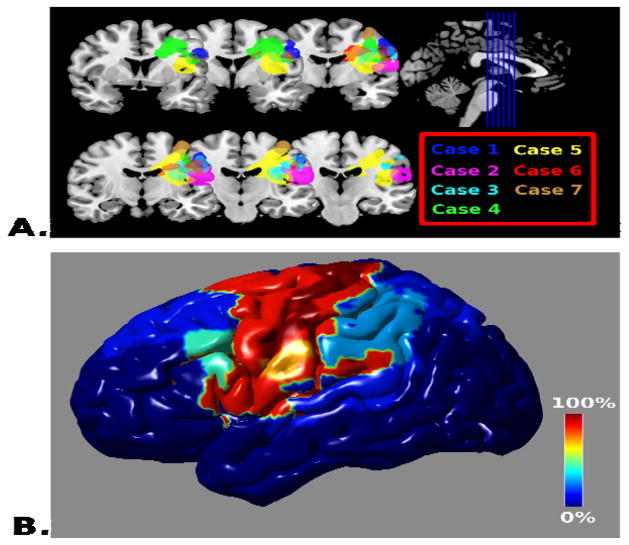
Figure 1.
Topographic Distribution of Lesion Apraxia of Speech (A) The lesions for each of the seven cases is overlaid on coronal sections of the template brain using MRIcron(Rorden & Brett, 2000) with color coding matching the case numbers in the Table. (B) The regional frequency of lesion occurrence within Brodmann’s areas (expressed as the percentage of cases located within the region) displayed on a rendering of the cortical surface using the BrainNet Viewer (http://www.nitrc.org/projects/bnv/).

