
Figure 7.
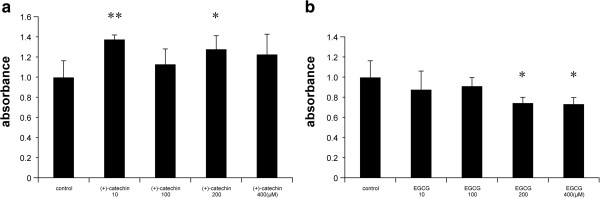
Comparative evaluation of cytotoxicity between (+)-catechin and EGCG in fibroblasts. Fibroblasts were treated with PBS (control) or the indicated concentrations of (a) (+)-catechin and (b) EGCG for 24 h. Cell viability was assessed by the MTT assay. Data are expressed as the mean ± SEM. *P < 0.05 and **P < 0.01.