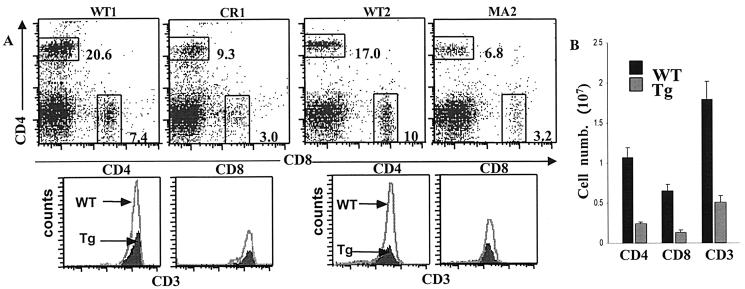
FIG. 2.
SinΔC expression inhibits production of mature T cells. (A) Splenocytes (106) from 6- to-8-week-old wild-type (WT) and transgenic (Tg) animals were triply stained with CD4-allophycocyanin/CD8-peridinin chlorophyll-a protein and CD3-fluorescein isothiocyanate and analyzed by flow cytometry. In the dot plots, the numbers indicate the percentage of cells in each region. Histograms represent CD3 expression within the CD4 and CD8 SP populations in the dot plots. Two different transgenic founder lines, CR1 and MA2, with their respective wild-type controls, are shown. (B) Splenocytes were counted and stained, and the percentages of total CD3 T cells and CD4+ and CD8+ subpopulations were determined by fluorescence-activated cell sorting analysis and used to calculate the actual cell numbers for each population. Results from at least five wild-type and MA2 transgenic mice are represented as the mean ± the standard deviation (SD).

