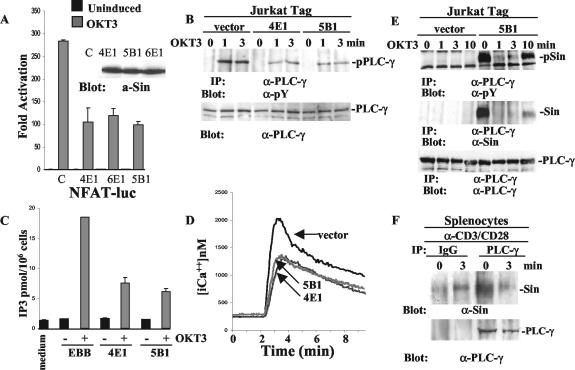
FIG. 5.
Defective PLC-γ phosphorylation and activation in Jurkat cells stably overexpressing Sin. (A) Sin overexpressing stable Jurkat Tag cells from three different lines were transiently transfected with NFAT-firefly- and HSV-TK-Renilla-luciferase reporters and stimulated with 5 μg of OKT3/ml as described in Materials and Methods. A representative of at least three experiments performed in triplicate is shown. The fold activation was determined as described in the legend to Fig. 4. Sin expression levels in these cell lines are shown in the inset. a-Sin, anti-Sin. (B) Jurkat cells (107) from control (vector alone) and two different Sin-expressing cell lines were stimulated with OKT3 (5 μg/ml) for the indicated times, and cell lysates were immunoprecipitated with anti-PLC-γ-specific antibody. Immune complexes were separated by SDS-PAGE, and the Western blot was probed with an antiphosphotyrosine antibody. Total lysates of the same samples normalized for protein content were processed in parallel to reveal levels of endogenous PLC-γ. (C) IP3 levels were determined as described in Materials and Methods. One of three representative experiments is shown. (D) Intracellular calcium concentration in the presence or absence of Sin from one control and two stable cell lines was measured as described in Materials and Methods. Shown is a representative of at least four experiments. (E) Control or Sin-expressing Jurkat Tag cell lines (5 × 10⁷) were stimulated with OKT3 (5 μg/ml) for the indicated times, and cell lysates were immunoprecipitated with PLC-γ-specific antibody. The separated immune complexes were transferred on nitrocellulose membrane, and the upper half of the membrane was probed with anti-PLC-γ (bottom panel), whereas the lower half was probed first with anti-Sin (α-Sin) antibody (middle panel) and then stripped and reprobed with antiphosphotyrosine-specific antibody (top panel). (F) Extracts of 9 × 10⁷ total splenocytes from wild-type mice stimulated with anti-CD3/CD28 (α-CD3/CD28) antibodies (15 μg/ml each) were immunoprecipitated with anti-PLC-γ or control IgG. The upper and lower halves of the membrane containing the immune complexes were probed with anti-PLC-γ and anti-Sin (α-Sin) antibodies, respectively. Protein bands were visualized by enhanced chemiluminescence (ECL). α-PLC-γ, anti-PLC-γ; pPLC-γ, phosphorylated PLC-γ, α-pY, antiphosphotyrosine; pSin, phosphorylated Sin.

