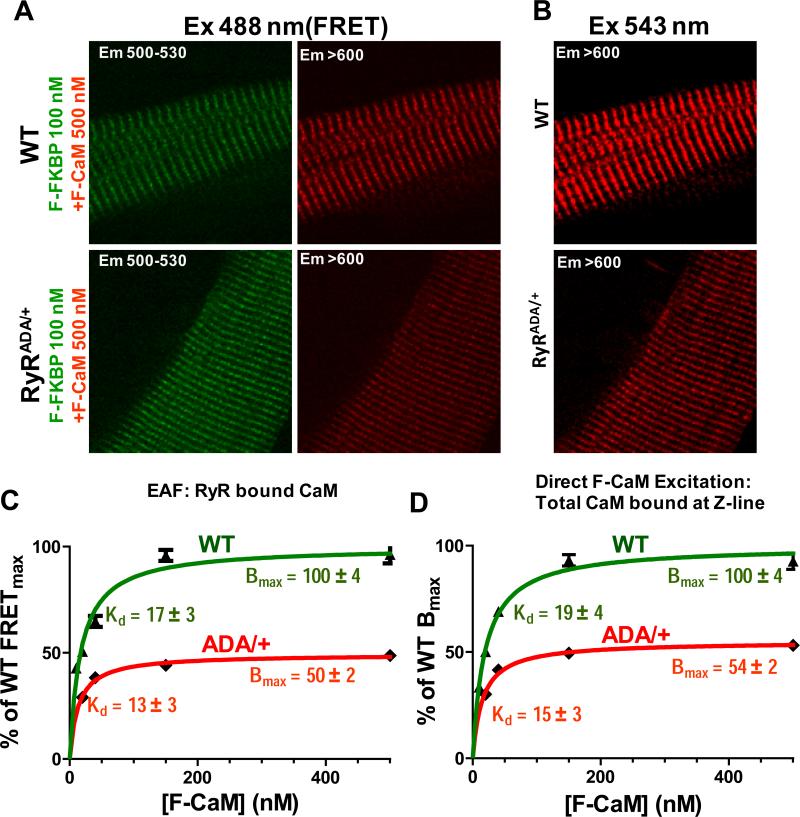
Figure 3. Percentage of Z-line CaM that is on RyR2.
A, FRET images in saturating F-CaM and FFKBP12.6 conditions for WT and RyR2ADA/+. B, Z-line bound F-CaM images (direct F-CaM excitation) for WT and RyR2ADA/+. C, Steady state CaM binding, with Bmax normalized to WT level and with Kd inferred (n=12-20). D, Total Z-line associated F-CaM with Bmax and Kd for RyR2ADA/+ and WT mice (n=14-20).

