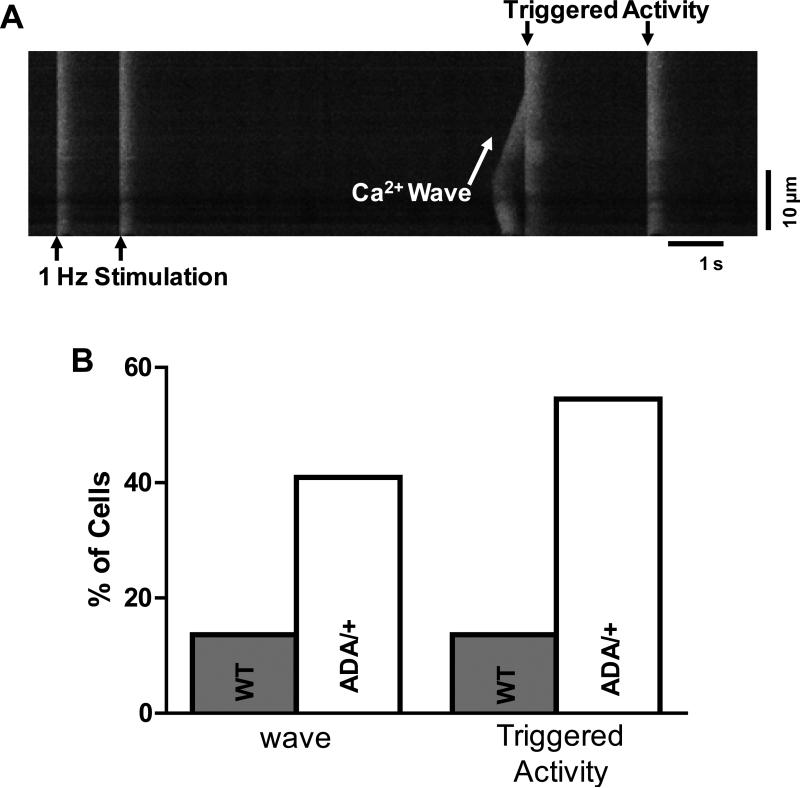
Figure 6. Arrhythmogenic Ca2+ waves in isoproterenol-treated myocytes.
A, representative line-scan image of Ca2+ wave (sloping [Ca2+] rise) and triggered activity in intact myocyte with 50 nm ISO. The almost instantaneous spread of SR Ca2+ release at triggered beats indicates that action potentials were induced. B, Percentage of myocytes exhibiting Ca2+ waves and triggered activity for WT (n=24) and RyRADA/+ (n=22).

