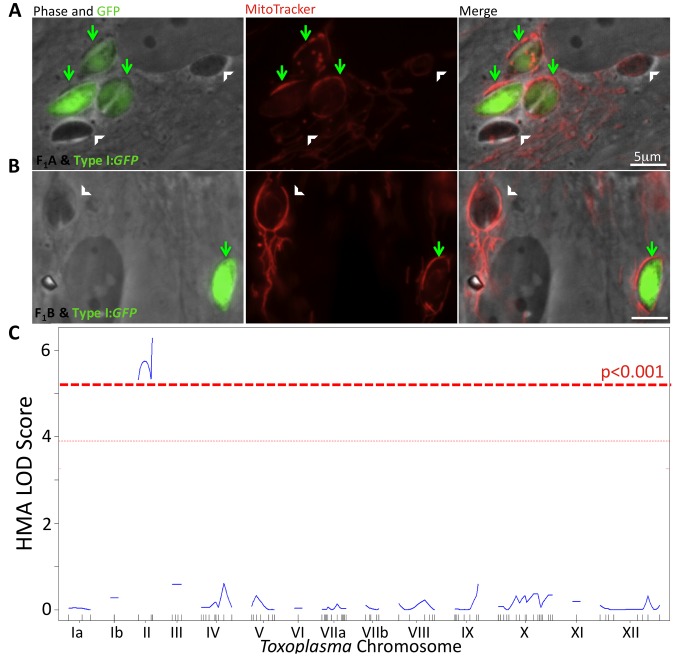
Figure 2. HMA phenotype maps to Toxoplasma chromosome II.
HFFs were labeled with MitoTracker and then co-infected with a type I GFP+ strain (arrows) and either of two nonfluorescent F1 progeny (white arrowheads), (A) STG2 (F1A, top panel) and (B) E7 (F1B, bottom panel). Cells were fixed 4 hpi and visualized by fluorescence microscopy. Phase and green fluorescence (GFP) are shown in the first image of each panel. Next to that is the red fluorescence (MitoTracker) followed by a merged image of the two. Scale bar, 5 µm. (C) LOD Score plot indicates the log-likelihood of association of HMA with markers across the entire Toxoplasma genome in numerical chromosome order.

