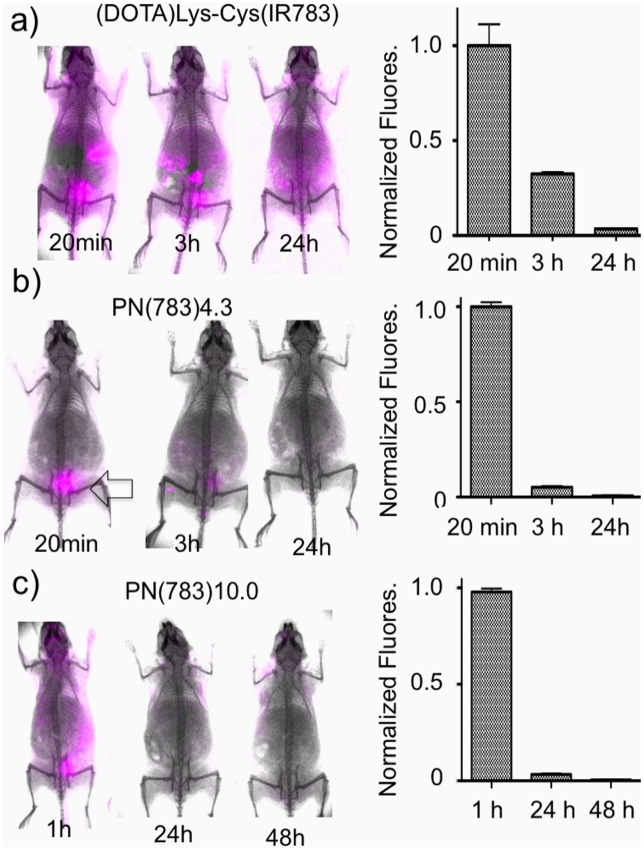
Figure 3. Role PEG in determining elimination by surface fluorescence imaging.
A) Animals were injected with unPEGylated peptide and imaged at the times indicated. Bar graph gives whole animal surface fluorescence determined as means and standard deviations, n = 6. B) With the 5 kDa PEG attached, PN(783)4.3 is obtained, which shows renal elimination within 20 minutes (arrow). C) With the 30 kDa PEG, PN(783)10.0 is obtained, which shows a long vascular phase followed by elimination. Biodistribution and elimination of 111In-PN(783)10.0 is shown in Figure 6.

