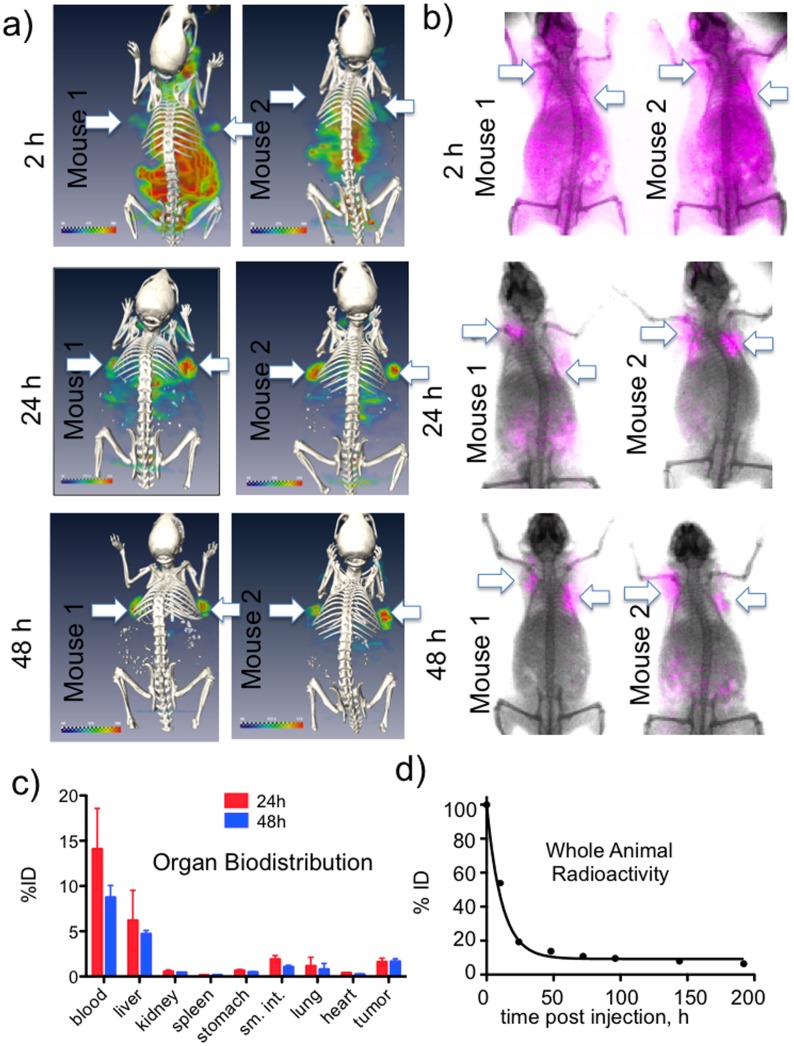
Figure 6. Multimodal imaging of EPR tumor targeting and elimination of PN(783)10.0.
A) SPECT/CT images of two mice bearing two HT-29 tumors as a function of time after injection. At 2 h post injection, agent is in the blood and interstitium. By 24 h post-injection tumors are becoming apparent as agent is being cleared. At 48 h, labeling is highly tumor selective. B) Surface fluorescence imaging of two additional mice bearing the same tumor. By surface fluorescence, as with SPECT, labeling is highly tumor selective at 48 h. C) Organ biodistribution was obtained by dissection and 111In counting at 24 h and 48 h post-injection. Data are means and standard deviations, n = 5. D) A whole animal radioactivity elimination curve. Data are means and standard deviations, with extremely small standard deviations, n = 5.

