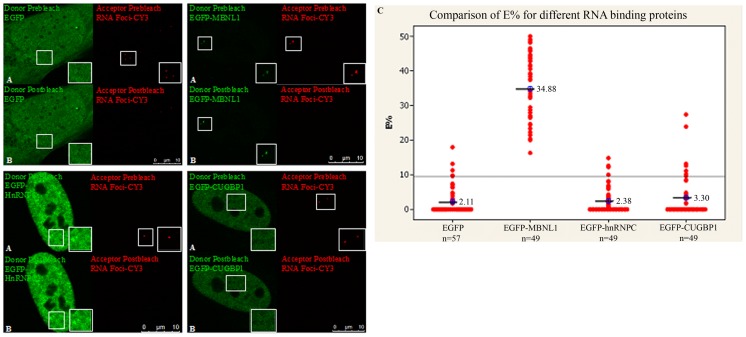
Figure 3. Demonstration of intracellular interaction between RNA foci and EGFP-MBNL1 using AP-FRET.
DM1 fibroblasts were transfected with plasmids encoding EGFP-MBNL1, EGFP-hnRNPC, EGFP-CUGBP1 and EGFP alone. RNA-FISH was carried out 48 h post-transfection with CY3-(CAG)10 antisense probe. EGFP-CY3 was used as FRET pair. Representative donor and acceptor (A) pre-bleach and (B) post-bleach images for each experiment are shown. Strong dequenched signal from the donor could be seen only for EGFP-MBNL1 after photobleaching the acceptor. (C) E% distribution for different ROIs shows E% for EGFP-MBNL1 with an average of 34.8% (n = 49) and lower or background level E% distribution for EGFP-hnRNPC (n = 49) and EGFP-CUGBP1 (n = 49) similar to EGFP alone (n = 57). Line on graphs represents the positive FRET threshold level.

