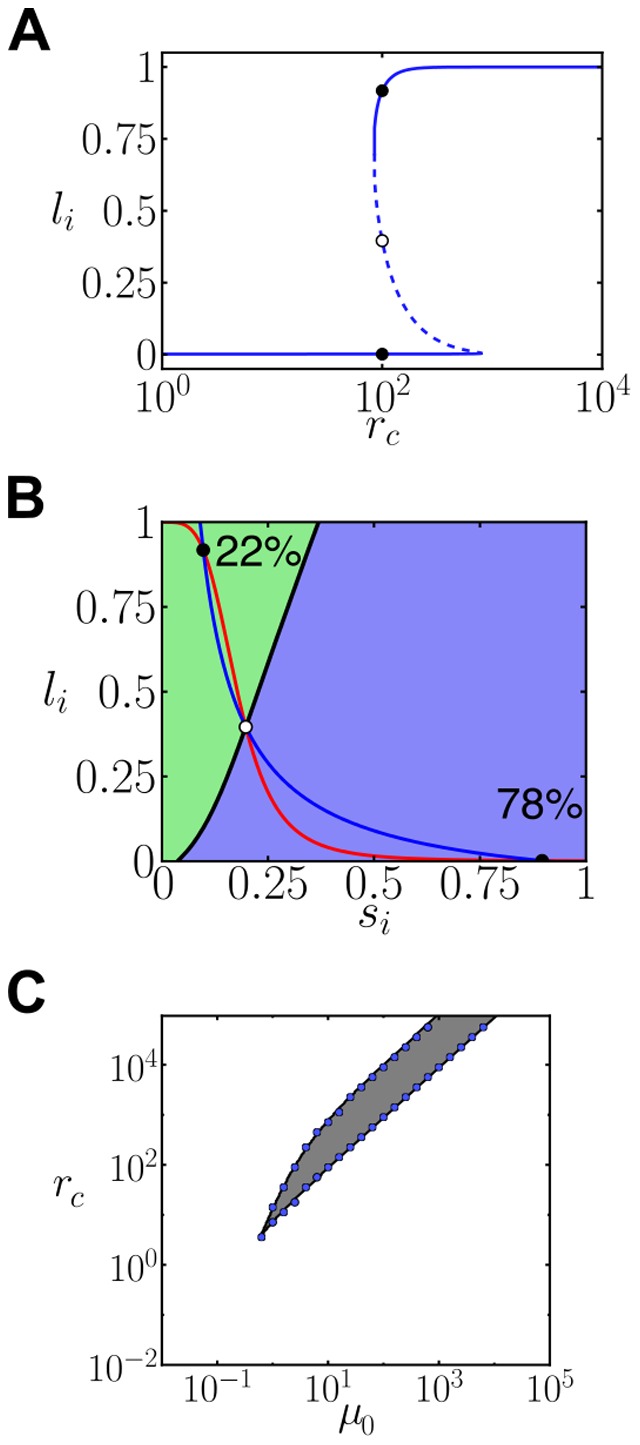
Figure 7. Cis-inhibition with a primary Notch signaling source creates cell-autonomous bistability.

(A) Stationary ligand level as a function of the cis-interactions strength  for
for  and
and  . Solid lines denote linearly stable solutions, dashed lines indicate linearly unstable solutions. Black dots refer to the stationary ligand levels for
  . (B) Nullclines diagram showing the three possible solutions at
  . The blue and red lines represent the nullclines. The continuous black line is a separatrix, which divides the parameter space into two basins of attraction of the two stable solutions. Percentages indicate the fraction of cells reaching the corresponding stable state computed from
  cells with initial random uniform levels of ligand. (C) Phase diagram showing the cell-autonomous bistability region zone where two states are linearly stable. The gray area is the theoretically computed region, and the blue circles correspond to simulation results (Methods). Parameter values:
  ,
,  ,
,  and
and  for all panels. These results can also be obtained for
  in the cis-inhibition regime (data not shown).
