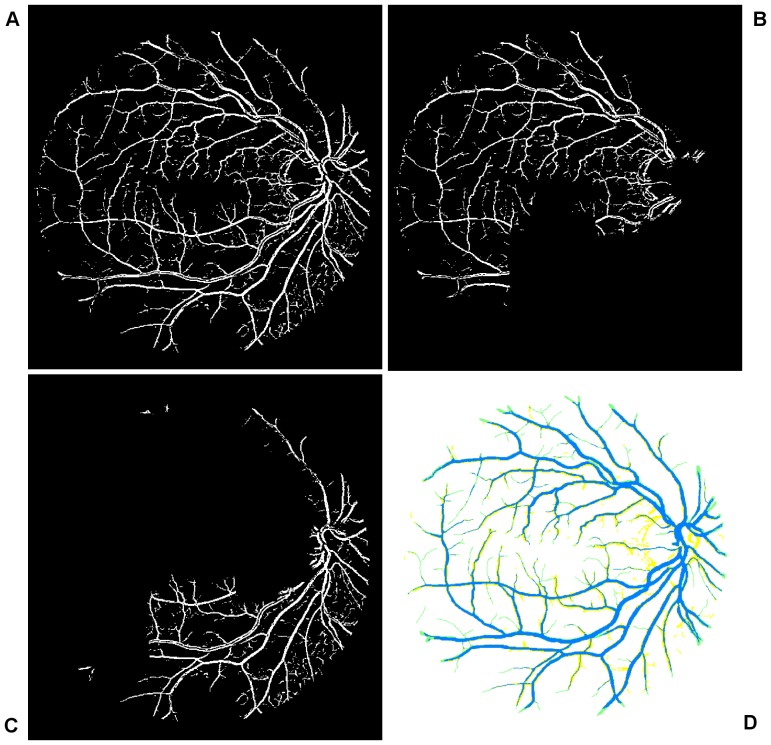
Figure 7. Overview of the main steps taken by our algorithm when processing a fundus image.
(A) Illustration of globally thresholded image after multiplication between Fig. 4 and Fig. 5(A). (B) and (C) Illustration of two partitions of segmentation of (A) according to color coded mapping in Fig. 3(B). (D) Illustration of good overlapping (blue) between the resultant segment (yellow) and gold standard segment (green).

