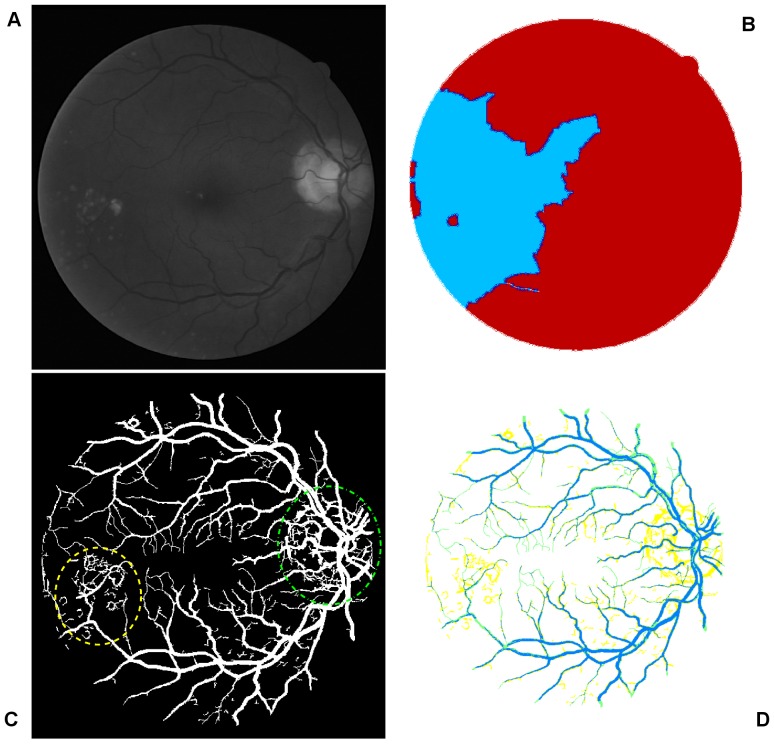
Figure 12. A further example showing the source of noise effects.
(A) The green channel of original image named 08_test. (B) Colour coded mapping. (C) Final segmentation with noise effect partly from pathological tissue, indicated by yellow dash line, and partly from optic disk, indicated by green dash-dot line. (D) The superposition of the segmentation produced by our algorithm and manual segmentation, the yellow part of which represents the misclassified pixels of retinal blood vessels.

