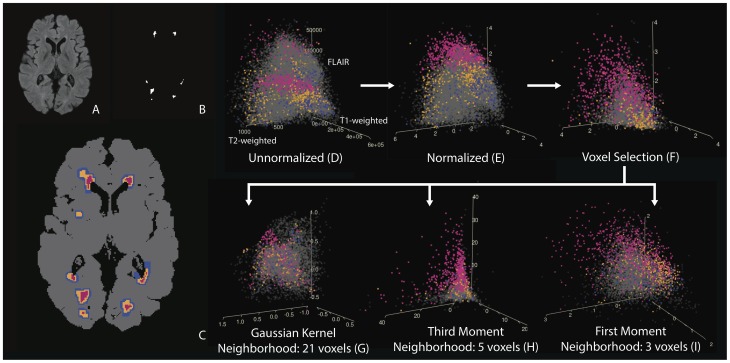
Figure 1. Scatter plots of the T1-w, T2-w and FLAIR voxel intensities and functions of these intensities for 10,000 randomly sampled voxels from 5 randomly sampled subject's MRI studies.
Each point in the plot represents a single voxel from a study. (A–C) Color key for these plots: (A) the FLAIR volume for an axial slice from a single subject's MRI study, (B) the technician's manual segmentation for this slice and (C) the colors that are used in the plots corresponding to this slice. Lesion voxels are pink, voxels within 1 mm of a lesion voxel are orange, voxels within 2 mm of a lesion voxel are blue and all other voxels in the brain are colored grey. The arrows in the figure indicate the order that the features are created. For the unnormalized intensities there is no plane that can separate lesion voxels from non-lesion voxels, but after normalization and with the addition of features that include neighborhood information, a plane is able to separate lesion and non-lesion voxels with improved accuracy.

