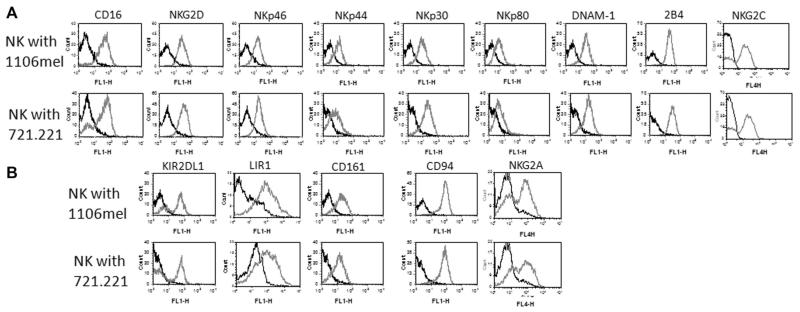
Figure 2.
Analysis of NK-cell receptor repertoire during NK-cell expansion. NK cells were cultured with 1106mel (top) or with 721.221 (bottom). After 10 days in culture the cells were stained for the various NK-cell (A) activating receptors and (B) inhibitory receptors (gray-line histograms). The black-line histograms represent staining with the secondary mAb only. Data shown are representative of three independent experiments performed.

