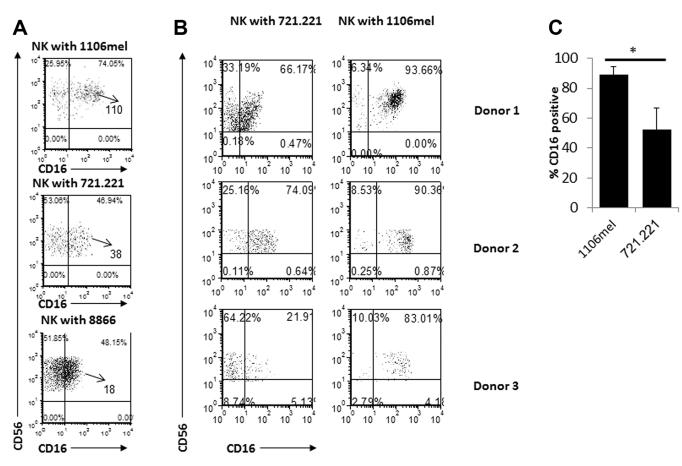
Figure 3.
Analysis of CD16 levels during NK-cell expansion. (A) NK cells were cocultured with 1106mel, 721.221, and 8866 cell lines for 5 days and then analyzed for CD16 expression. The numbers in the quadrants indicates percentages and the MFI are marked by an arrow. (B) NK cells were obtained from three different donors, incubated with 1106mel or with 721.221. The numbers in the quadrants indicates percentages. (A, B) Data shown are representative of two independent experiments. (C) The percentages of CD16+ NK cells following 5 days incubation with 721.221 or 1106mel were calculated after flow cytometric analysis and shown as mean SD of seven donors. *p < 0.02, by two tailed Student’s t-test.

