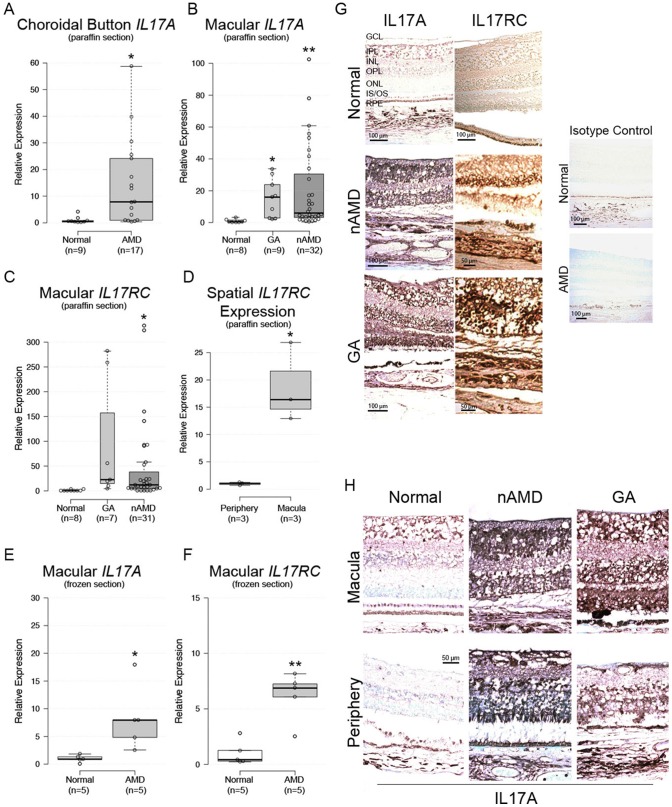
Figure 1. IL17A and IL17RC expression in AMD tissue.
IL17A mRNA expression in paraffin-embedded (A) sub-macular choroid button and (B) macula. (C) IL17RC mRNA expression in paraffin-embedded macula. (D) IL17RC mRNA expression in macula vs. periphery of 3 donors. (E, F) Macular IL17A and IL17RC mRNA were verified in paraformaldehyde-fixed fresh frozen tissue. (G) Immunohistochemical detection of IL17A and IL17RC in paraffin-embedded macular sections. Isotype controls lacked primary antibodies. (H) Comparison of macular and peripheral IL17A immunostains. For box plots: center lines show the medians; box limits indicate the 25th and 75th percentiles as determined by R software; whiskers extend 1.5 times the interquartile range from the 25th and 75th percentiles, outliers are represented by dots; width of the boxes is proportional to the square root of the sample size; data points are plotted as open circles; sample numbers are indicated beneath each column. GA = geographic atrophy; nAMD = neovascular AMD; GCL = ganglion cell layer; IPL = inner plexiform layer; INL = inner nuclear layer; OPL = outer plexiform layer; ONL = outer nuclear layer; IS/OS = inner/outer segment; RPE = retinal pigment epithelium. *: P<0.05; **: P<0.005; ***:P<0.0001.

