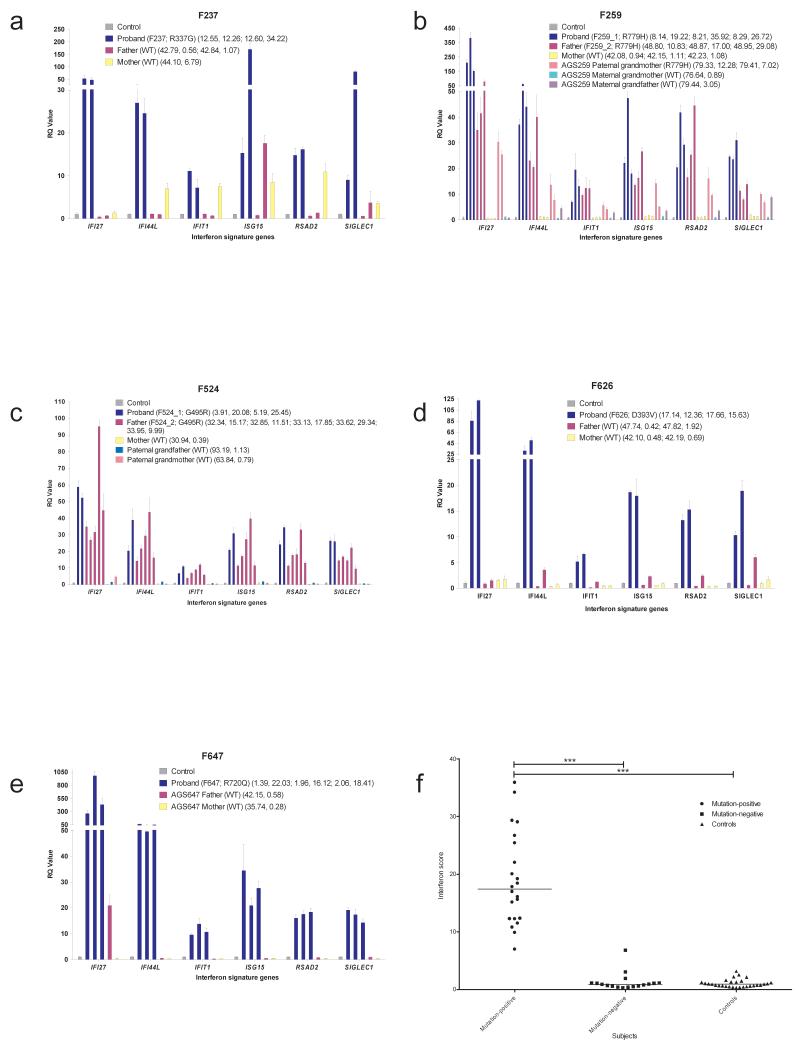
Fig. 2. Quantitative reverse transcription PCR (qPCR) of a panel of six interferon stimulated genes (ISGs) in whole blood measured in IFIH1 mutation-positive probands and mutation-negative relatives and interferon scores in mutation-positive individuals, mutation-negative relatives and controls.
(a – e) Bar graphs showing relative quantification (RQ) values for a panel of six interferon stimulated genes (ISGs) (IFI27, IFI44L, IFIT1, ISG15, RSAD2, SIGLEC1) measured in whole blood in five AGS families, compared to the combined results of 29 healthy controls. RQ is equal to 2−ΔΔCt, with −ΔΔCt ± standard deviations (i.e. the normalized fold change relative to a calibrator). Each value is derived from three technical replicates. Family / patient number followed by mutation status are given in the first brackets. Numbers in second brackets refer to decimalized age at sampling, followed by interferon score calculated from the median fold change in relative quantification value for the panel of six ISGs. Colors denote individuals, with repeat samples (biological replicates) denoted by different bars of the same color. (f) Interferon score in all patients, relatives and controls calculated from the median fold change in relative quantification (RQ) value for a panel of six interferon-stimulated genes (ISGs). For participants with repeat samples, all measurements are shown. Black horizontal bars show the median interferon score in mutation-positive, mutation-negative and control individuals. Data analyzed by one-way ANOVA using Bonferroni’s multiple comparison test (**** p<0.0001).

