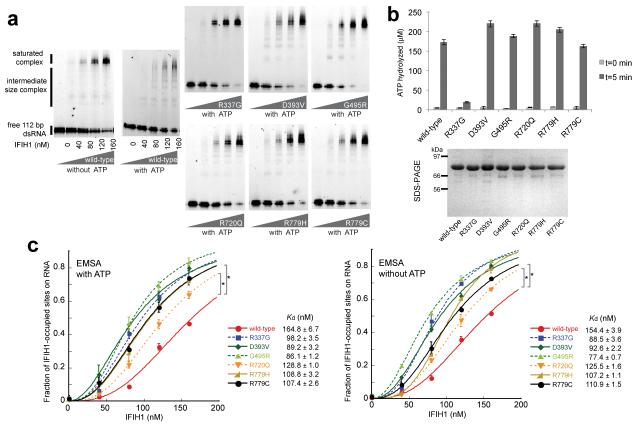
Fig. 4. IFIH1 mutants form filaments.
(a) Electrophoretic mobility shift assay (EMSA) of purified wild-type and mutant IFIH1 with 112 bp dsRNA. Gel images are representative of three independent experiments. (b) ATP hydrolysis activity (mean ± SD, n = 3) of wild-type and mutant IFIH1. Shown below is the SDS-PAGE analysis (Coomassie stain) of the purified wild-type and mutant IFIH1 used in Fig. 3. (c) Fraction of IFIH1-occupied sites on 112 bp dsRNA, measured from three independent EMSA performed in the presence and absence of ATP. *P<0.0002 (one tailed, unpaired t test), calculated using the values at 160 nM IFIH1. Bound fraction was calculated as in ref 12, and fitted with the Hill equation29. The dissociation constants (Kd) obtained from curve fitting are shown on the right.

