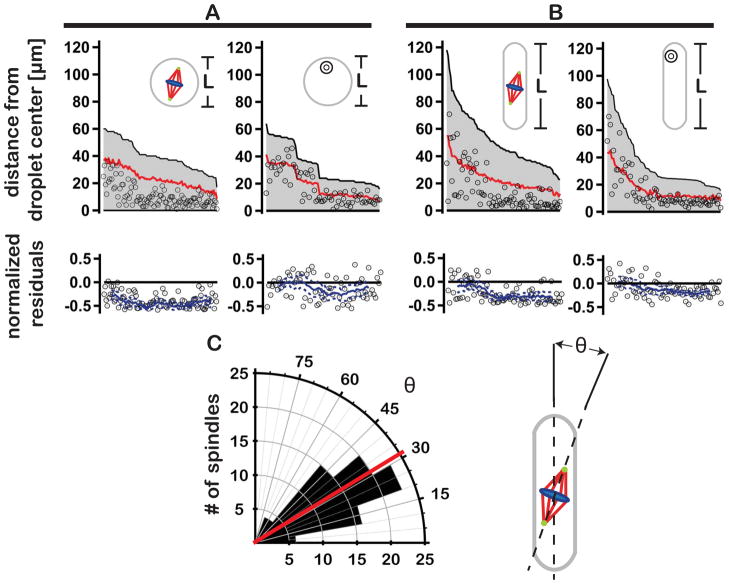
Fig. 4.
Spindles exhibit non-random positioning in spheres and slugs. (A) Plots show the positions of spindles (left panel) and polystyrene beads (right panel) within spherical droplets. Black lines in each of the plots reflect the distance between the droplet center and its most distal edge (L/2, shown schematically in insets). Open circles indicate the positions of spindles/beads in relation to the droplet center. Red lines depict the average absolute displacement of spindles/beads expected for uniform random positioning (see supplementary material). Corresponding residual plots show the normalized difference between the center-to-center position of the spindle or bead and the theoretical random position. Solid blue lines represent the moving average of residual values (with upper and lower 95% confidence intervals indicated by dashed blue lines). (B) As in A, spindle and bead positions in axially elongated slugs. (C) Spindle orientation in slugs. Left panel - polar histogram plot showing the angle θ between the interpolar spindle axis and the long axis of the confining slug (red line indicates the average orientation angle; n = 89 spindles). Right panel – cartoon depicting the determination of angle θ.

