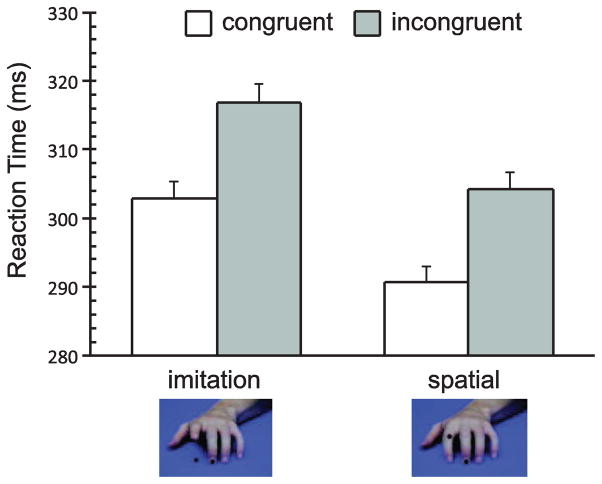
Figure 4.
Behavioral Results: Mean reaction time for each condition. Error bars represent within subject standard error of the mean, calculated with Cousineau’s adaptation of Loftus & Masson’s method {Cousineau 2005, Loftus 1994}. Main effects of congruency and cue type were significant (p < 0.01), but the interaction between cue type and congruency was not.

