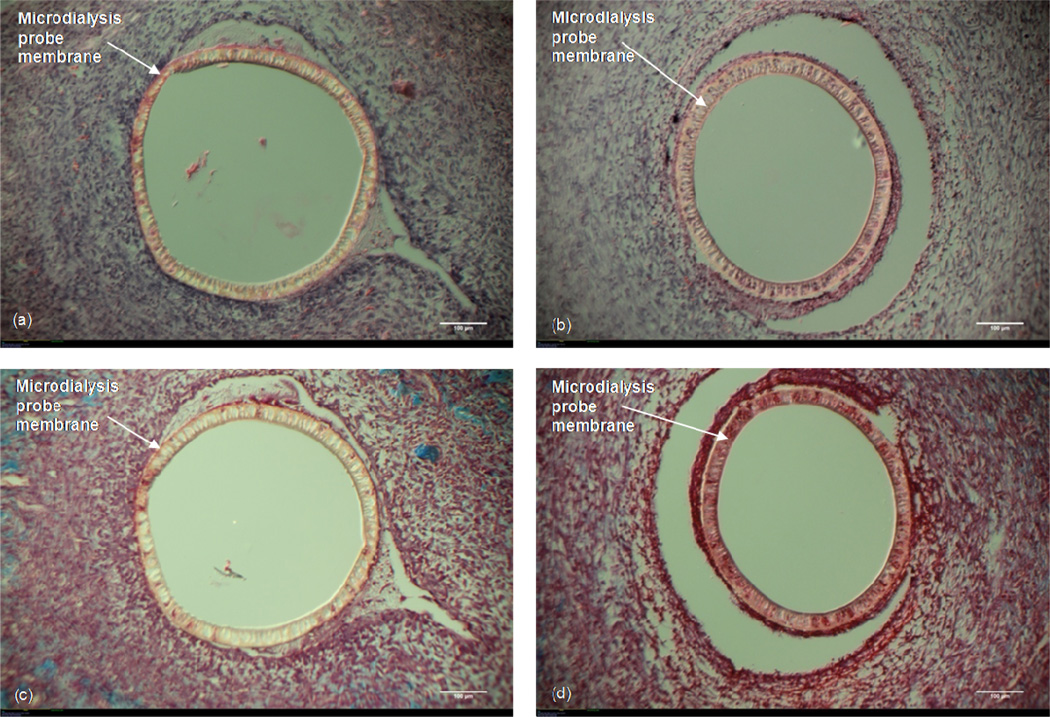
Figure 6. RSA vs. BSA.
10× Magnification. White size bar represents 100 μm. Top: H&E stain (a) Microdialysis probe perfused with Ringer's + 3% (w/v) BSA solution. (b) Microdialysis probe perfused with Ringer's + 3% (w/v) RSA. Bottom: Masson's Trichrome stain. (c) Microdialysis probe perfused with Ringer's + 3% (w/v) BSA solution. (d) Microdialysis probe perfused with Ringer's + 3% (w/v) RSA.

