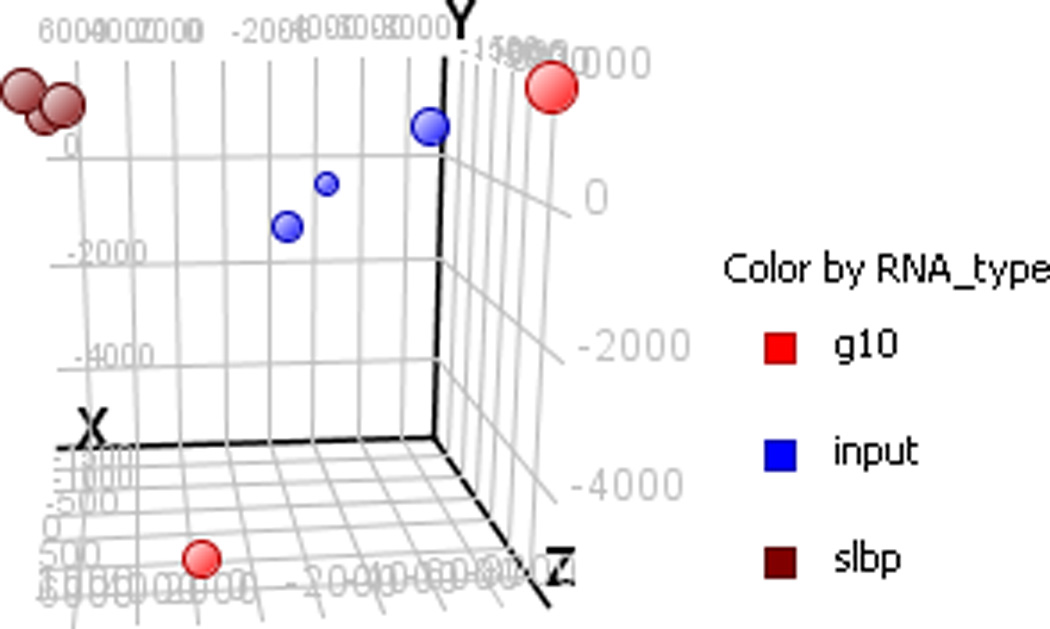
Figure 4.

Example of principal component analysis of samples from a stem loop binding protein (SLBP) RIP. PCA provides an indication of similarity amongst samples. This particular image shows some variation in the total transcribed RNA with a tighter correlation amongst the SLBP samples (expected if they represent a specific subset of the overall transcriptome). The G10 samples are poorly correlated, which is to be expected if they reflect mostly random background binding (note there are only two G10 replicates in this example).
