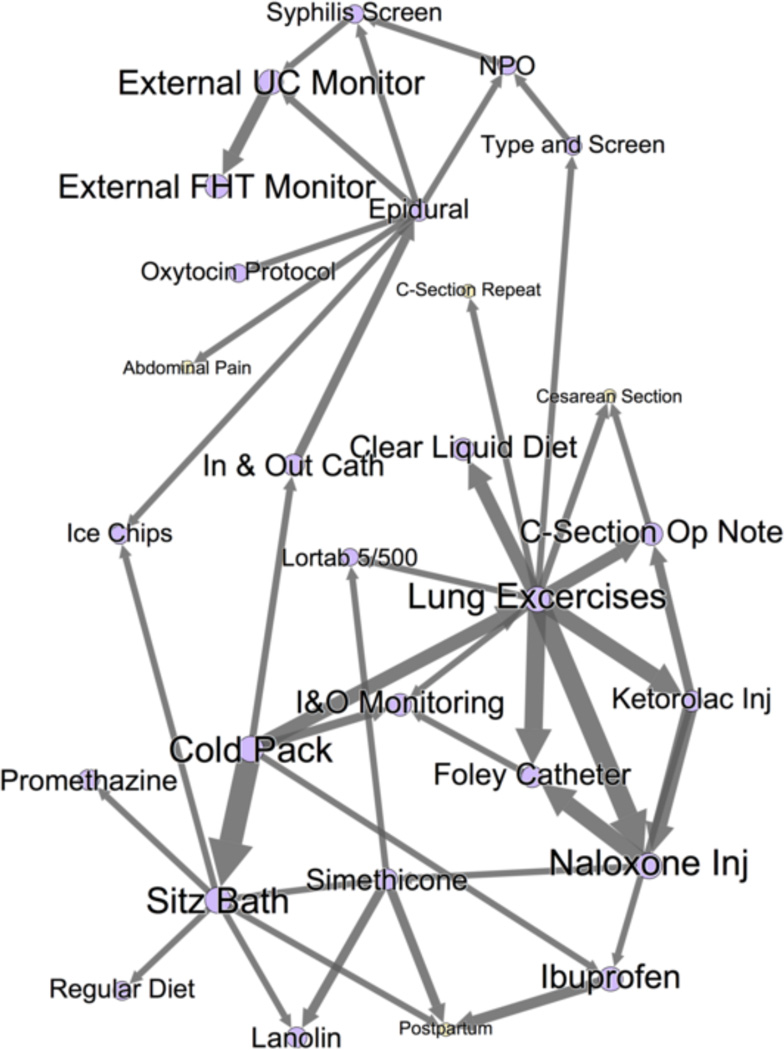
Figure 4.
A portion of the inpatient pregnancy networks. This figure shows the Markov blankets of C-Section Operative Note, Ext. UC Monitor, and Sitz Bath, three nodes with high AUC in Table 4. These three Markov Blankets comprise the majority of the total graph, and the graph forms one single connected component - indicating strong relationships between all nodes in this network. Orders are purple; problem/complaints are yellow. Node/label size is proportional to AUC, and edge weight is an approximation of the strength of relationship. Notice the highly-correlated clusters, e.g. Sitz bath and other postpartum treatments (cold pack, ice chips, lanolin, etc).

