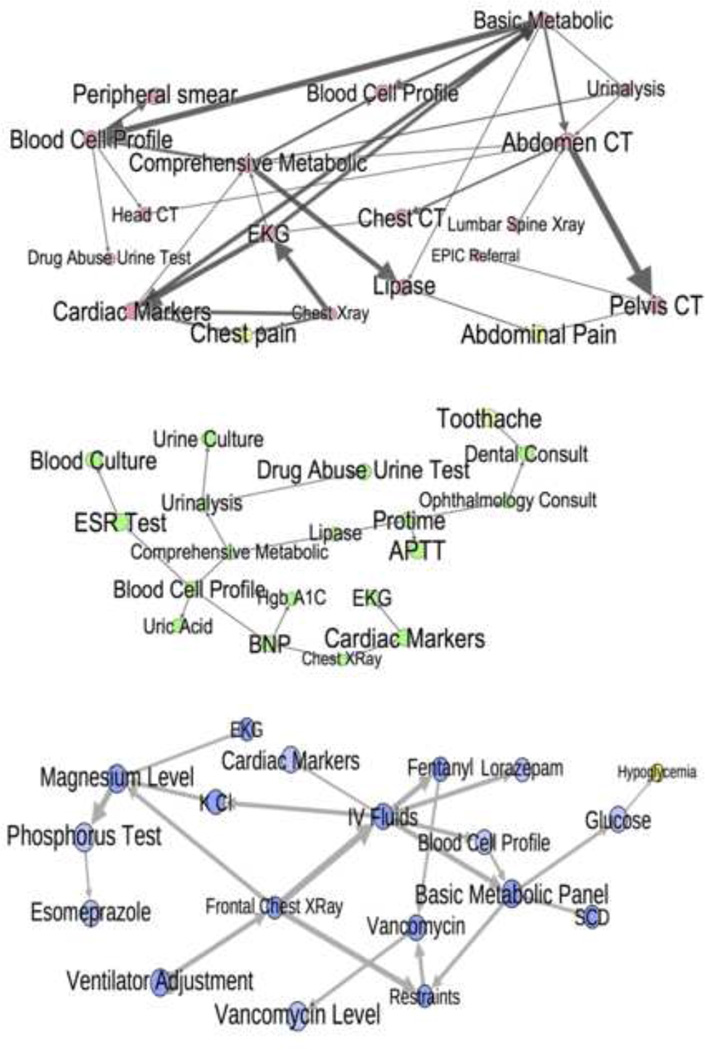
Figure 5.
High AUC nodes from Table 4 with their parents and children in all domains but inpatient. MICU is blue, UVC is green, and ED is red. Problems/complaints are yellow. Node/label size is proportional to AUC, and edge weight is an approximation of the strength of the relationship. Here, notice the logical clusters and intuitively correct relationships.

