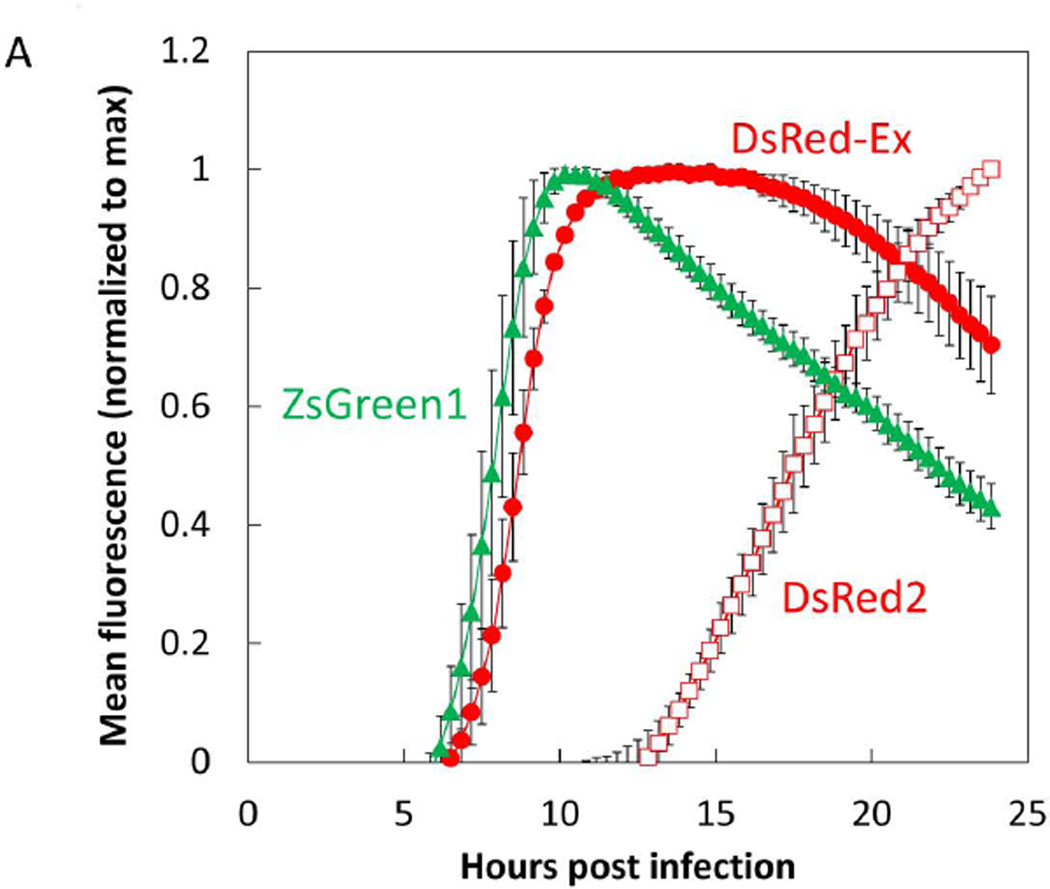
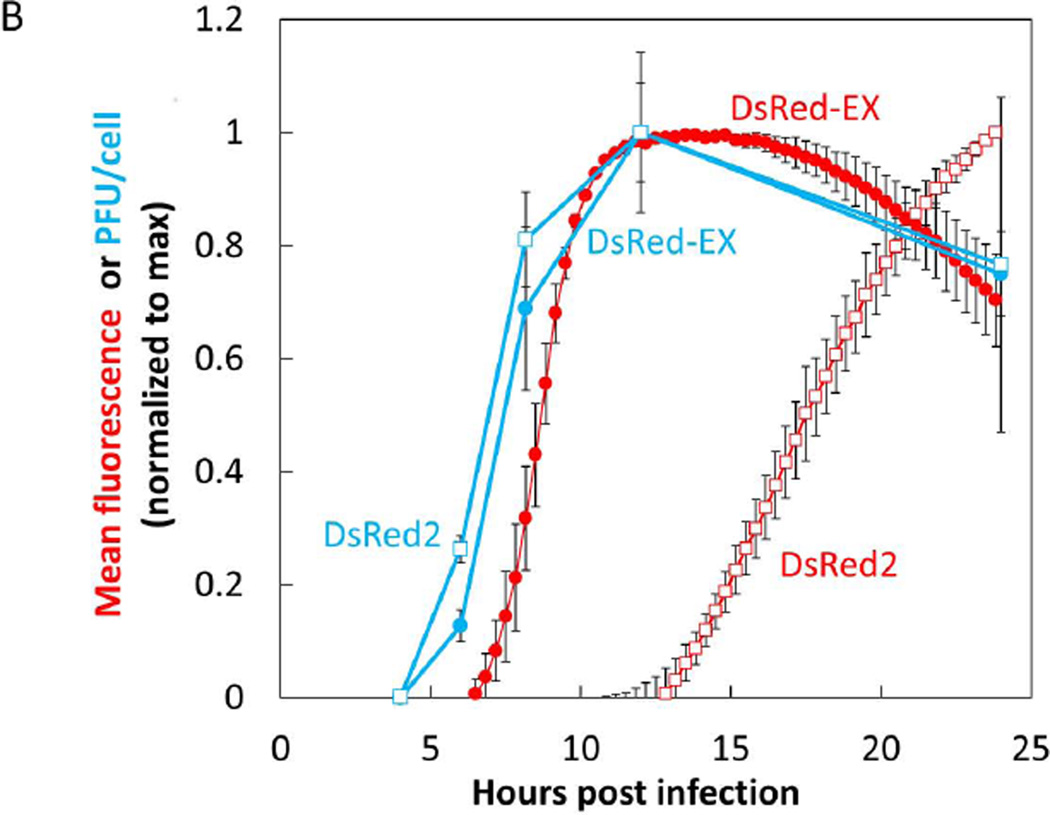
Figure 3. Fluorescence kinetics of DsRed-Ex are similar to ZsGreen kinetics and correlated with virus production.
(A) BHK cells were infected at an MOI of 10 with the VSV-DsRed-Express, VSV-DsRed2, or VSV-ZsGreen1- strain. Infected monolayers were imaged by live-cell microscopy every 20 min with 4 fields per well at 10X magnification. Total field intensity was quantified and normalized to the number of cells in the field imaged (cell number determined by counting nuclei). Background intensity calculated from mock infected wells was subtracted, the total field intensity was normalized to the maximum value of each well, and the normalized value of 3 replicate wells was averaged. Data points represent the mean of 3 replicate wells with error bars of 1 standard deviation. DsRed-Ex fluorescence (red filled circle) was found to have similar kinetic parameters (earliest time detectible, time to max level) as ZsGreen1 fluorescence (green filled triangle). Conversely DsRed2 fluorescence (red open square) was delayed 5–6 hrs relative to the other two strains.
(B) BHK cells were infected at an MOI of 10 with either the VSV-DsRed-Express or VSV-DsRed2 strain. Infected monolayers were imaged by live-cell microscopy every 20 min and mean field intensity was determined and expressed as described in 3A. Supernatant samples from parallel wells were harvested at regular intervals and titered by plaque assay with 3 biological replicates at each timepoint. Virus titers at each timepoint were averaged and both mean values and 1 standard deviation were expressed as normalized to the maximum timepoint (12 HPI for both strains). DsRed-Ex fluorescence (red filled circle) was found to have similar kinetic parameters (earliest time detectible, time to max level) as DsRed-Ex virus production (blue filled circle). Conversely DsRed2 fluorescence (red open square) was delayed ~9 hrs relative to virus production (blue open square).


