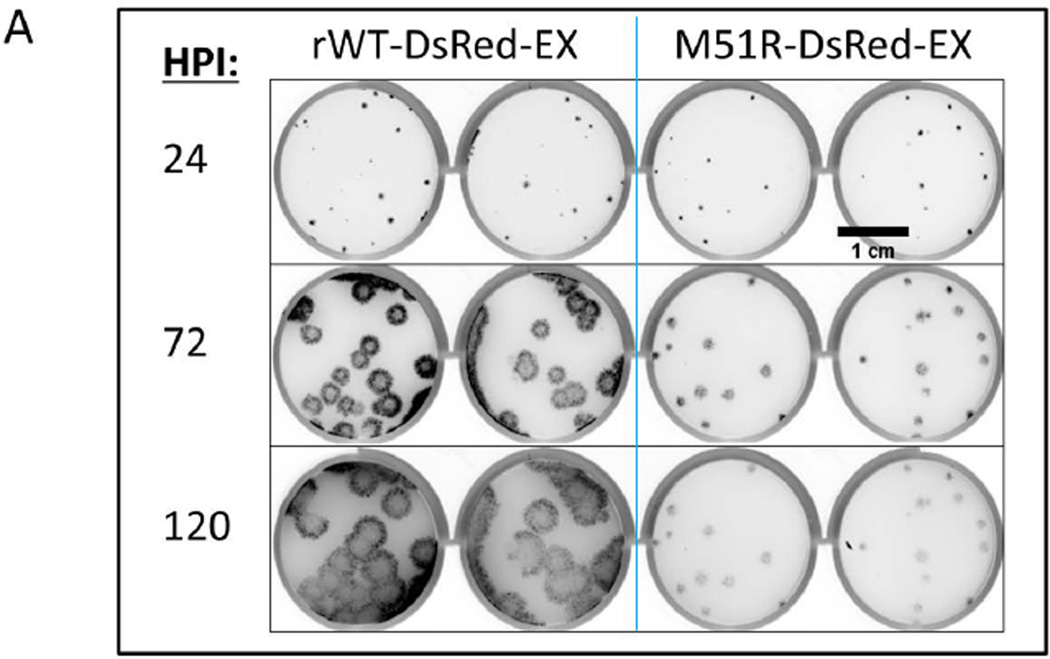
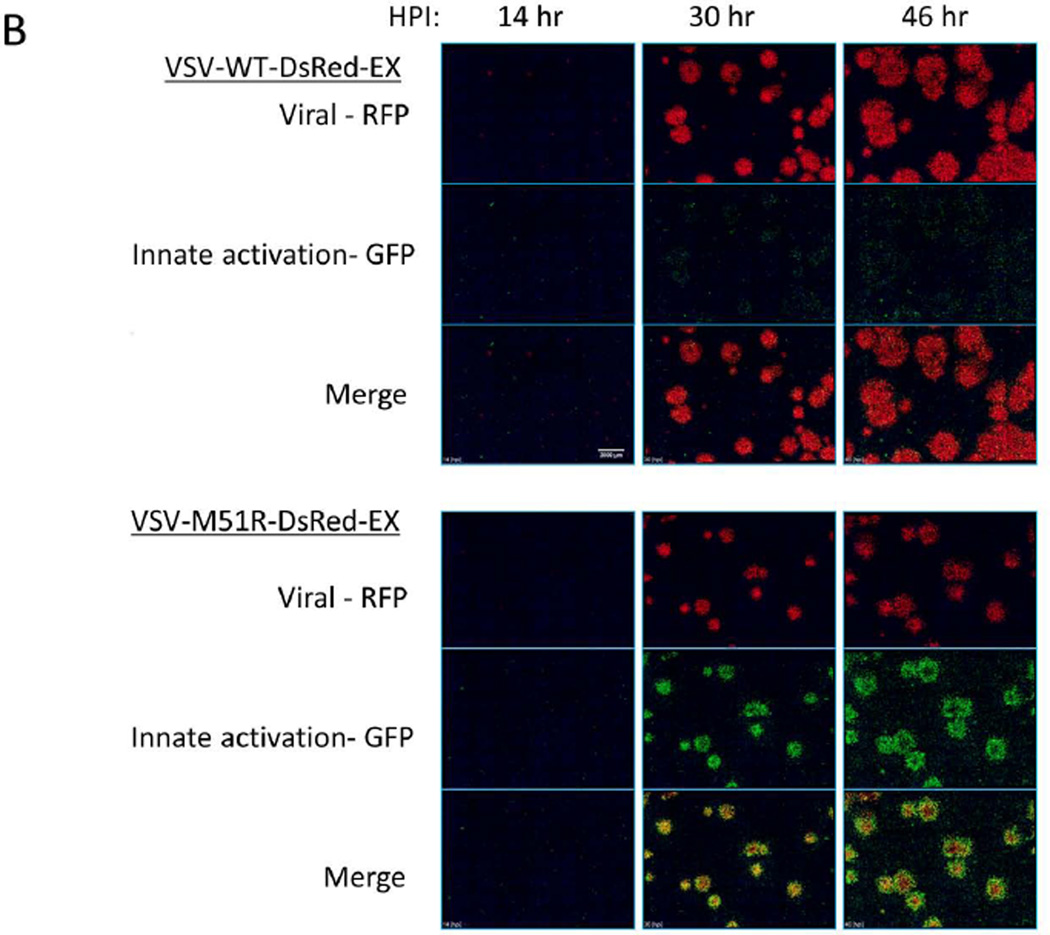
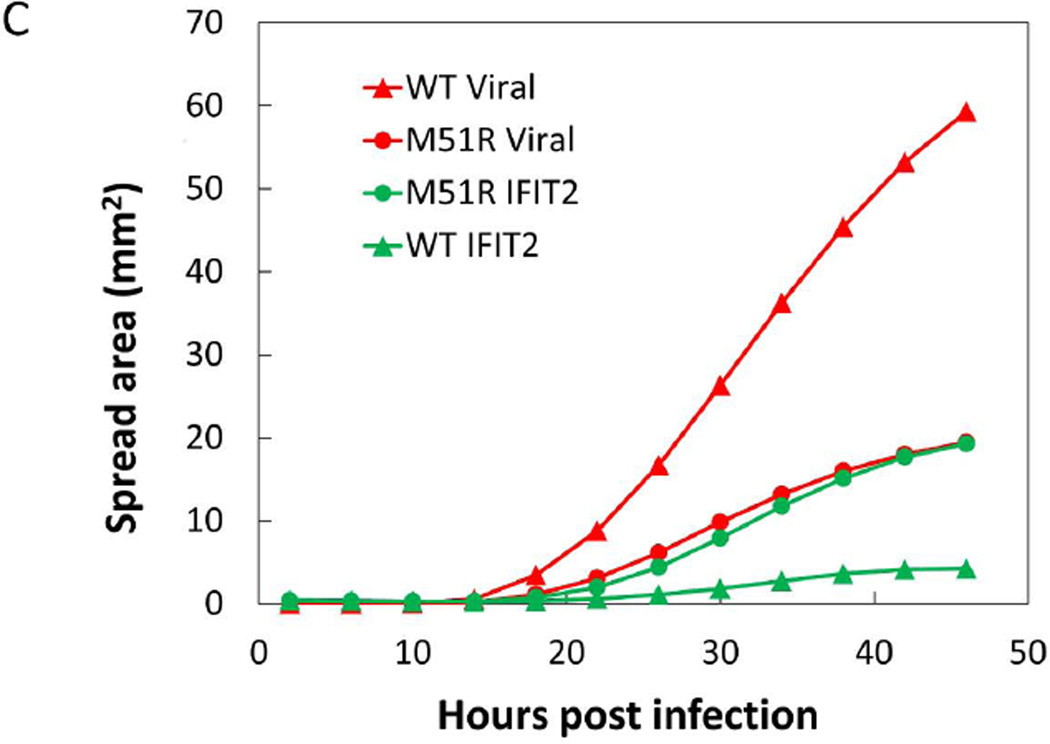
Figure 7. VSV spreading infection model suggests role of IFIT2 in limiting viral propagation.
(A) PC3 IFIT2-ZsGreen reporter cells were seeded into a 12 well plate and infected at a low (plaque forming) MOI and overlaid with a semi-solid media containing 0.6% agar. Every 24 hrs post infection the plate was removed from the incubator and scanned for RFP on a fluorescent plate scanner (GE Typhoon 9000), and then returned to continue incubation. At 24 HPI the WT and mutant plaques had grown to similar size, however by 72 HPI the WT plaques were considerably larger and continued to spread out to 120 HPI, while the M51R infections did not spread after 72 HPI.
(B) WT and M51R plaque infections were tracked using an automated fluorescent microscope fitted with a stage-top incubator chamber. Each images shown is a montage of a 7×7 array taken with a 4× magnification objective. Images underwent flat field correction and log transformation to enable visualization of both very dim and bright cells in the same image. Single channel images (red – viral RFP; green – IFIT2 reporter) display relative size and intensity of the two signals at timepoints shown, while the merged images show the location of the infected (red), IFIT2 active (green) and both infected and activated (yellow – orange) cells relative to each other. In general the WT infection produced strong infection spread and little IFIT2 activation. Conversely, in the M51R infection most cells were initially both infected and activated (see 30 hr), however, by later timepoints a ring of activated cells (green) had developed around the periphery of most plaques along with a dimmer more diffuse activation of cells distal to the infected regions. Scale bar is 2000 µm.
(C) Area of both infection and IFIT2 activation spread was determined by analysis of single channel images. Using ImageJ software, images were thresholded to identify positive pixels and total area above threshold was determined for each time-point.


