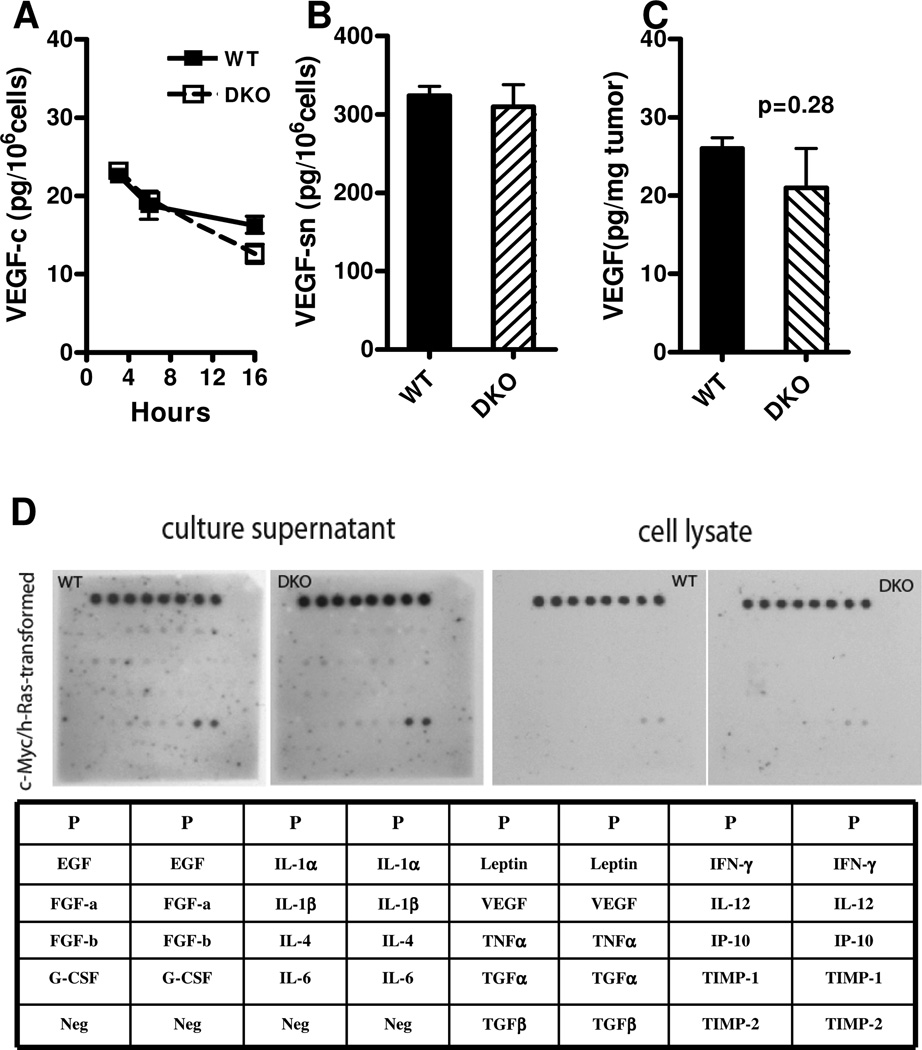
Figure 3. VEGF and other proangiogenic factors of WT and DKO cells.
Neither the VEGF content in cell lysates (panel A; WT vs. DKO at 16 hours: 16.2±1.9 vs. 12.6±2.2 pg/106 cells, p=0.1) nor in the corresponding 16-hour cell culture supernatants (panel B; WT vs. DKO, 324±23 vs. 310±51 pg released/106 cells, p=0.7) were significantly different. Panel C: Tumor VEGF content. Small WT (day 9, mean 87mm3, n=3) and DKO (day 14, 84mm3, n=3) tumors following injection of 105 cells were studied. VEGF was assayed by ELISA. The tumor VEGF contents were not significantly different (26±1.4 vs. 21±5 pg/mg tumor, p=0.3). Panel D: Angiogenesis factor screen of DKO and WT cells and culture supernatants by Western blotting. The table is the key for the western blot of angiogenesis factors, among which there were no differences in concentrations between DKO and WT cells or supernatants.

