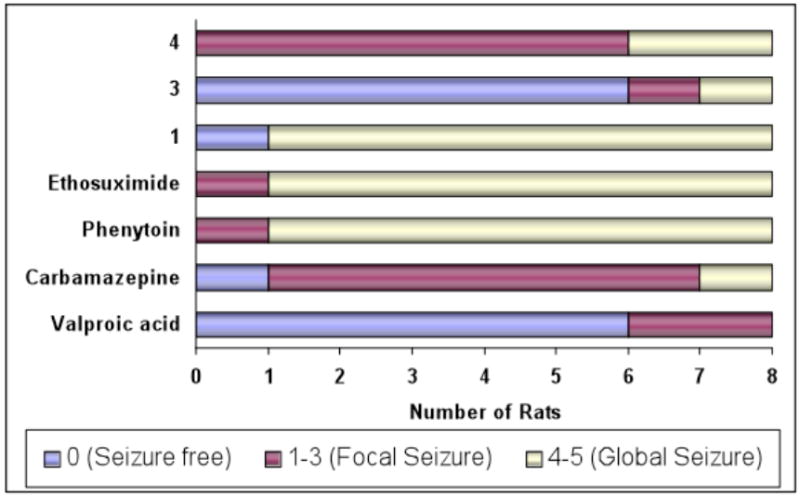
Figure 1.

Frequency distribution analysis for individual rats (N = 8 animals) in the hippocampal kindling model after treatment with various anticonvulsants (4, 3, 1, ethosuximide, phenytoin, carbamazepine, and valproic acid; vehicle: 0.5% aqueous methylcellulose). The color code represents the number of rats out of eight that evinced the particular seizure response noted (seizure free, focal seizure, global seizure). Seizure scores were assessed at the time of peak effect and at the maximal effective dose.
