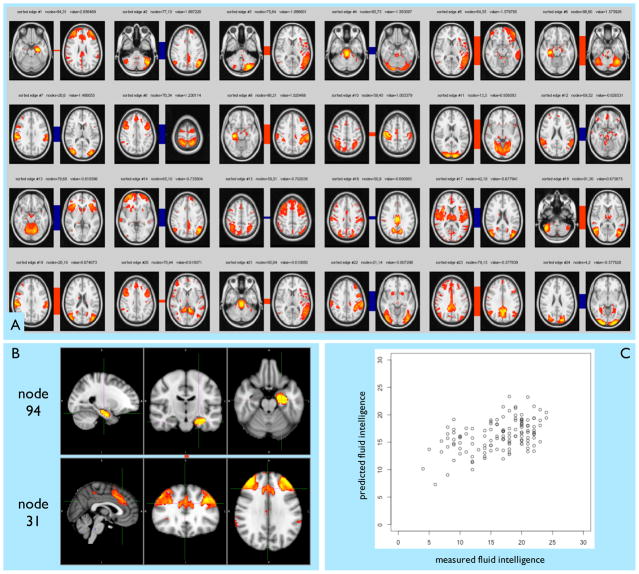
Figure 7.
A significant association was found between network matrices and fluid intelligence (FI), p<0.05 (corrected for multiple comparisons across all 91 behavioural variables tested). The 4753 edges were reduced using a Bayesian feature selection method [81] that only kept the 98 edges most strongly predictive of FI, and applied ridge regression (L2) shrinkage on those kept features (see Box 2); over-fitting was avoided by carrying out the feature selection and shrinkage inside a leave-one-out loop. Statistical significance was estimated using subject-wise permutation testing to derive p-values on the model fitting, taking into account the family structure in the data, such that cross-subject correlations were correctly handled. A) The 24 edges (node-pairs) that (on average) had the strongest weights in the regression are shown. The coloured bars connecting the two nodes in each pair reflect the overall group-average connection strength. Each edge’s weight in the multiple regression is noted as the “value”. B) The node-pair which contributes most strongly to the regression against FI is shown in more detail; left hippocampus (generally associated with memory/recall) and medial/lateral frontal regions (generally associated with cognitive control). C) Predicted vs. measured FI, with one data point per subject; each subject’s FI was predicted using their network matrix, where the linear regression model was trained excluding the data from that subject (and all of their family members).

