Figure 2.
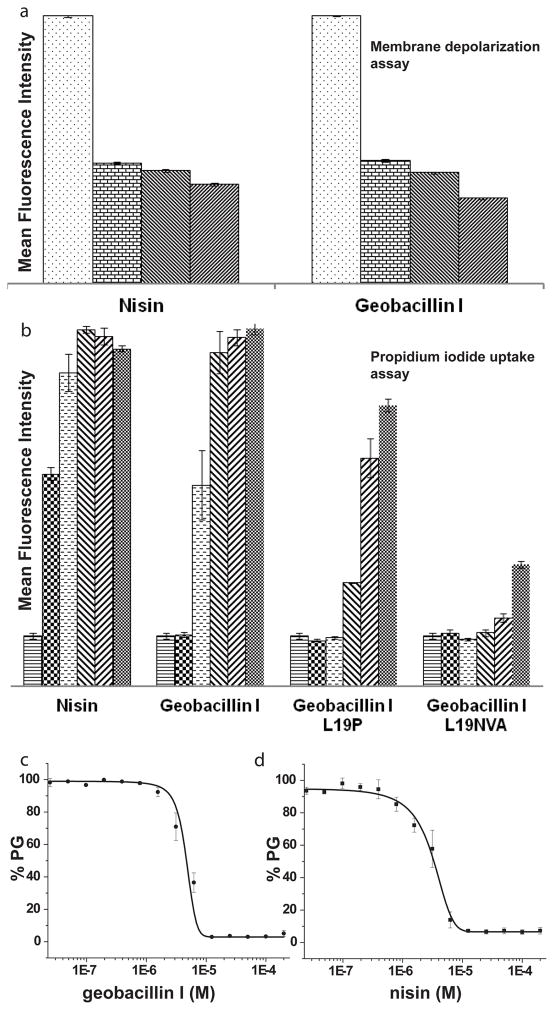
The effect of geobacillin I and nisin on the membrane integrity of B. subtilis ATCC 6633. (a) Average mean fluorescence intensity (MFI) of triplicate flow cytometry measurements with different concentrations of nisin and geobacillin I using DiOC2 as indicator of membrane potential. The different bars represent concentrations of 0, 0.2, 2, and 20 μM (left to right). For a representation using the ratio of fluorescence at 610 and 530 nm, see Supplementary Figure S2. (b) Increase in MFI resulting from propidium iodide uptake by B. subtilis ATCC 6633 in response to treatment with nisin and geobacillin I (average of three measurements). The different bars represent concentrations of 0, 0.31, 1.25, 2.5, 5 and 10 μM (left to right). (c) Inhibition of PBP1b-catalyzed peptidoglycan (PG) formation by geobacillin I and nisin, at a lipid II concentration of 4 μM and a PBP1b concentration of 100 nM. Error bars represent the standard deviation from triplicate experiments.

