
Figure 3.
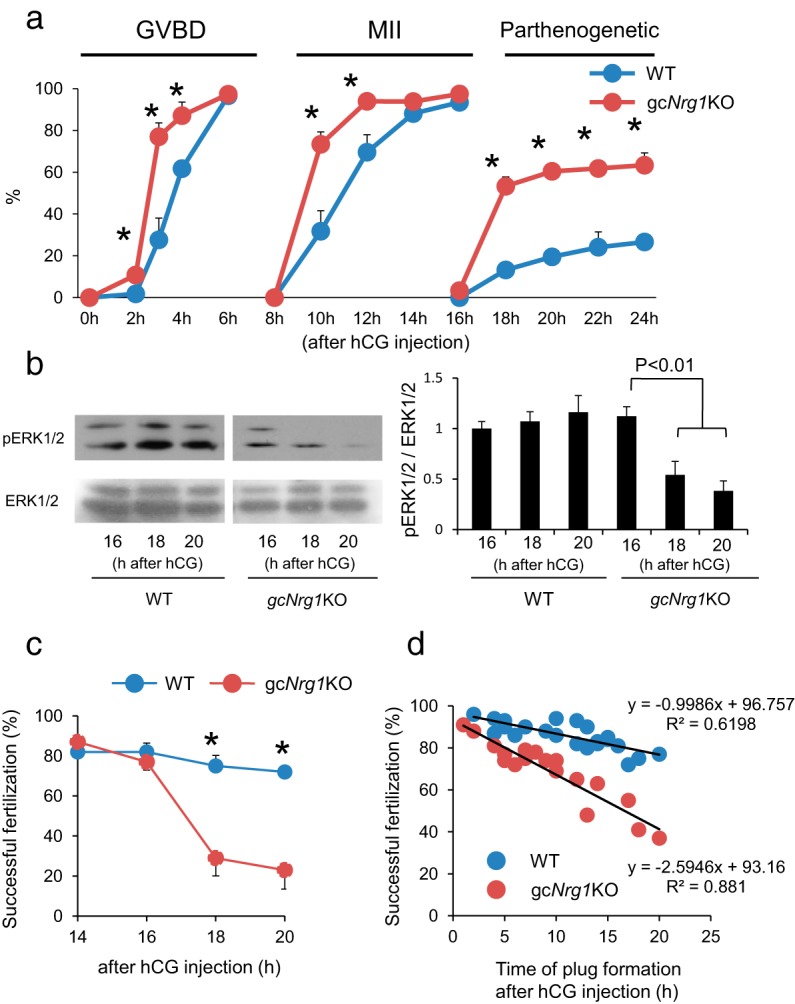
The kinetic changes of meiotic progression and fertilization of oocytes in gcNrg1KO mice. A, Timing of GVBD, arrest at the MII stage, or remeiotic resumption beyond the MII stage in oocytes of gcNrg1KO and WT mice after hCG was analyzed. Oocytes were collected from preovulatory follicles, periovulatory follicles, or oviducts of hormone (eCG-hCG)-primed female mice and stained by DAPI and anti-acetylated tubulin. Oocytes at each time point were collected from at least 5 female mice of each genotype (at the 2, 3, or 4 hour point; 10 female mice were used for each time point). *, P < .05, significant differences were observed between the genotypes at each time point. Values are means ± SEM of data from more than 5 female mice. % GVBD, the percentage of oocytes exhibiting germinal vesicle break down; MII, the percentage of oocytes arrested at meiotic metaphase II stage; parthenogenetic, the percentage of oocytes that reresumed meiosis from the MII stage to anaphase II, telophase II, or pronuclear stage. B, Phosphorylation level of ERK1/2 (p44/p42MAPK, MAPK3/1) in ovulated oocytes recovered from WT or gcNrg1KO mice at 16, 18, or 20 hours after hCG injection. The intensity of the bands was analyzed using a Gel-Pro Analyzer. Values are means ± SEM of 3 replicates. The phosphorylation level of ERK1/2 in the16 hours WT oocytes was set as 1. Significant differences were observed in oocytes of gcNrg1KO mice by the additional period (18 or 20 hours point) after hCG injection as compared with that at the 16 hour point. C, IVF of oocytes was reduced in a time-dependent manner in gcNrg1KO but not in WT mice. The ovulated oocytes were recovered from the oviducts of at least 3 female mice of each genotype at 14, 16, 20, or 24 hours after hCG and then analyzed by IVF protocols. The y-axis shows the percentage of successful fertilization (2 pronuclei and sperm tail). *, P < .05, significant differences were observed between the genotypes. Values are means ±SEM of 3 replicates. D, Relationship between the time of mating (plug formation) and successful in vivo fertilization of oocytes (1 female pronuclei and 1 male pronuclei with sperm tail as described in image A in Supplemental Figure 3) was determined in gcNrg1KO and WT mice mated with WT male mice. WT female mice (n = 22) or KO female mice (n = 18) were injected with eCG followed 48 hours later by hCG. An adult proven fertile male was placed in each cage at 0, 5, 10, or 15 hours after hCG injection. The mice were checked for the plug formation every 1 hour to determine the time of mating. The rate of successful fertilization (1 female pronuclei and 1 male pronuclei with sperm tail) was shown in y-axis and the time of plug formation after hCG injection was shown in x-axis.