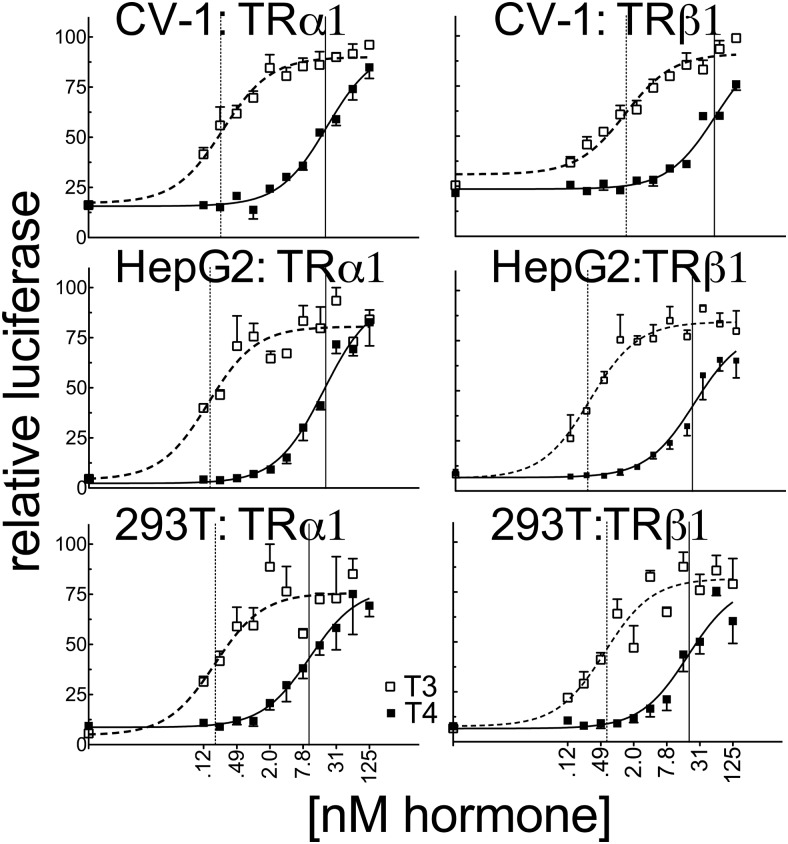
Figure 3.
The ability of TRα1 to respond to T4 vs T3 differs in CV-1, HepG2, and HEK293T cells and substantially exceeds observed affinity differences determined in vitro. CV-1, HepG2, and HEK293T cells were transiently transfected as described for Figure 2 with the consensus DR4-CON-tk-luciferase reporter. Luciferase values were normalized against the β-galactosidase control for each sample and plotted as percent T3 maximum. Error bars indicate SEMs of at least 3 biological replicate experiments. Unfortunately, we could not measure the TR protein levels expressed in these transfected cells due to limitations arising from the relatively low levels of expression and technical limitations as to the commercially available anti-TR antibodies. Vertical dashed and solid lines represent EC50s T3 and T4, respectively.

