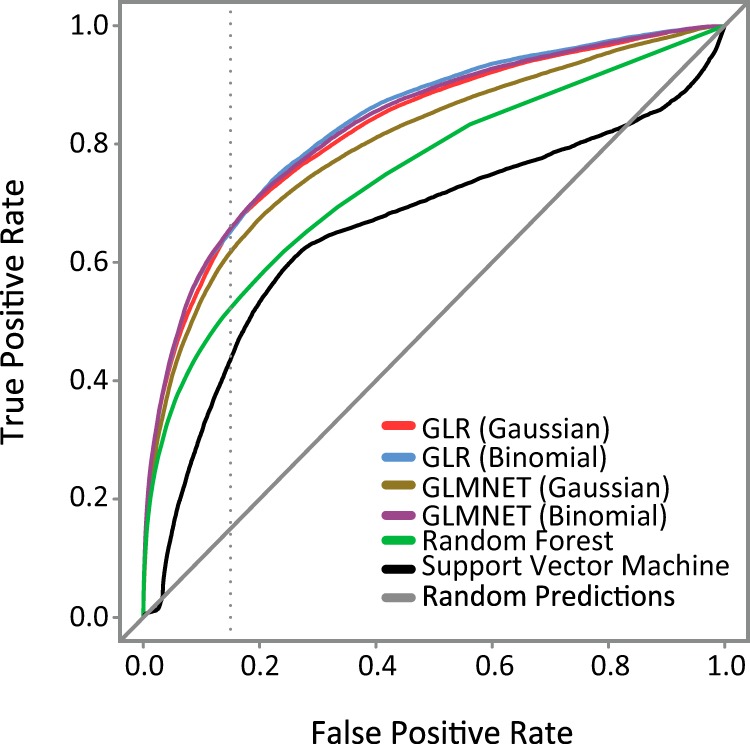
Figure 2.

Performance evaluation for different integrative models. Individual integrative models were evaluated using ROC curves. The top performing model, generalized linear regression (GLR) with a binomial link function, was designated as the EPSLiM model. The dotted gray line was placed at the 15% FPR. Corresponding TPRs and the AUROCs are reported in Table 1. A 15% FPR corresponds to the threshold of 0.02 for the EPSLiM model.
