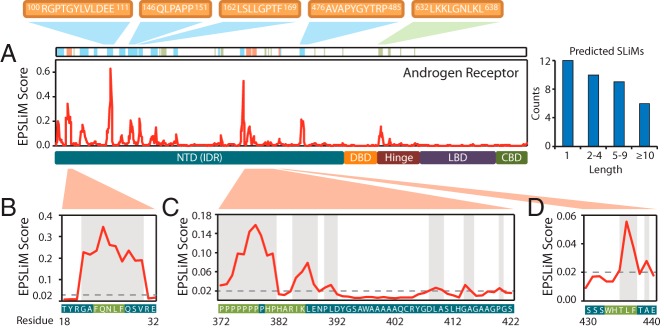
Figure 6.

EPSLiM predictions on disordered regions of AR. A, In AR, EPSLiM predictions are observed in the NTD and hinge region. Highlighted in red are predicted SLiMs with supporting experimental validation. Highlighted in blue are regions with high EPSLiM scores that match patterns found in the ELM database. Highlighted in green are regions with high EPSLiM scores but no additional supporting information. B, An EPSLiM peak was detected at AR 21–30, which overlaps with AR 23–27 (FXXLF), a validated SLiM that is important in the intramolecular interaction between the AR N-terminal and C-terminal domains. The gray dashed line is the EPSLiM threshold; the protein sequence and position are located below the EPSLiM line plot with the validated SLiM highlighted in green. C, Six regions in AR 378–422 were predicted by EPSLiM, the binding area for the AR-Src interaction. Highlighted in green, the first two predictions in this region overlap with 2 key binding motifs for Src (AR 372–378 and AR 380–386). D, AR 423–427 (WXXLF) is another validated SLiM that is responsible for the AR N/C intramolecular interaction.
