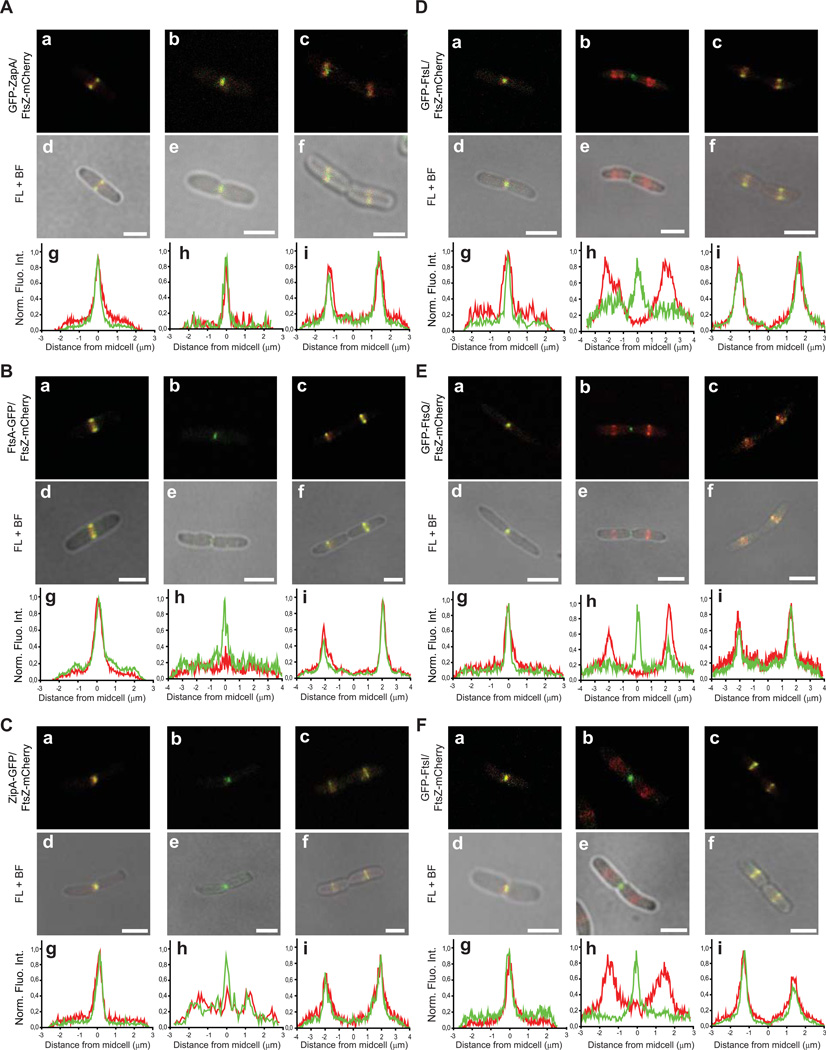
Figure 3. FtsZ-mCherry disassembles from the divisome before other divisome proteins.
Live cells co-expressing FtsZ-mCherry and GFP-ZapA, FtsA-GFP, ZipA-GFP, GFP-FtsL, GFP-FtsQ or GFP-FtsI were monitored throughout cell division. Representative images of the different localisation patterns are shown. The figures show fluorescence images, with and without bright field images. Beneath each image are the corresponding fluorescence profiles of FtsZ-mCherry (red) and the respective GFP fusion (green). These profiles were generated by integrating the fluorescence intensity originating from an area through the longitudinal axis of the entire cell. The width of the area varied so that it encompassed the fluorescent signal. Scale bar: 2 µm.

