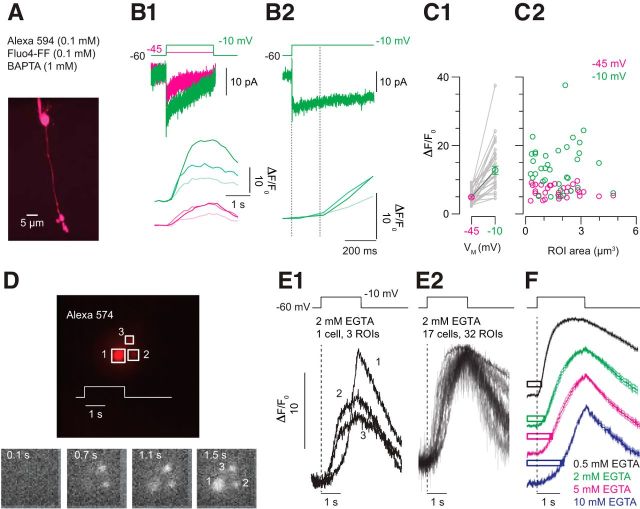
Figure 5.
Ca2+ imaging reveals buffer saturation. A, An image stack acquired by 2PLSM illustrates an RB filled with Alexa 594 (visualized) and Fluo-4FF (data not shown). It is evident that the axon terminal structure comprises several varicosities. B1, Steps to −45 (magenta) and −10 mV (green) evoke Ca currents (top) and elicit changes in Fluo-4FF fluorescence (bottom). Responses from three different varicosities are shown. It is evident that there is heterogeneity between varicosities. B2, The Fluo-4FF signal is delayed relative to the voltage step and the Ca current (average delay ± SEM is 179 ± 11 ms for steps to −10 mV and 264 ± 11 ms for steps to −45 mV; n = 35 observations from n = 14 cells; p < 0.007 by Wilcoxon test). C, Summary data illustrating that the amplitude of the Fluo-4FF signal increases with Ca current (C1) and that the variability in signal between varicosities is not dependent upon varicosity volume (n = 35 observations from n = 14 cells; p < 0.001 by Wilcoxon test). D, An RB terminal visualized using epifluorescence imaging with a fast CCD camera has three lobules (top). Depolarization of the terminal with a 2 s step to −10 mV elicits changes in Fluo-4FF fluorescence (bottom; time after the voltage step is noted; 2 mm EGTA in pipette). E1, Fluo-4FF signals acquired at high temporal resolution (∼90 Hz) illustrate variability between the varicosities shown in D. E2, Fluo-4FF signals recorded from 32 varicosities in 17 cells illustrate temporal variability in the [Ca2+] change within various terminal compartments. F, The time course of the Fluo-4FF signal varies with the terminal buffer capacity. Traces are averaged responses for [EGTA] = 0.5, 2, 5, 10 mm (n = 31 varicosities from n = 12 cells for 0.5 EGTA; n = 32 varicosities from n = 17 cells for 2 EGTA; n = 26 varicosities from n = 10 cells for 5 EGTA; n = 28 varicosities from n = 11 cells for 10 EGTA). The bars illustrate the average time to peak of the delayed EPSC ± SEM (Fig. 4) recorded with the same presynaptic buffer conditions.

