
Figure 8.
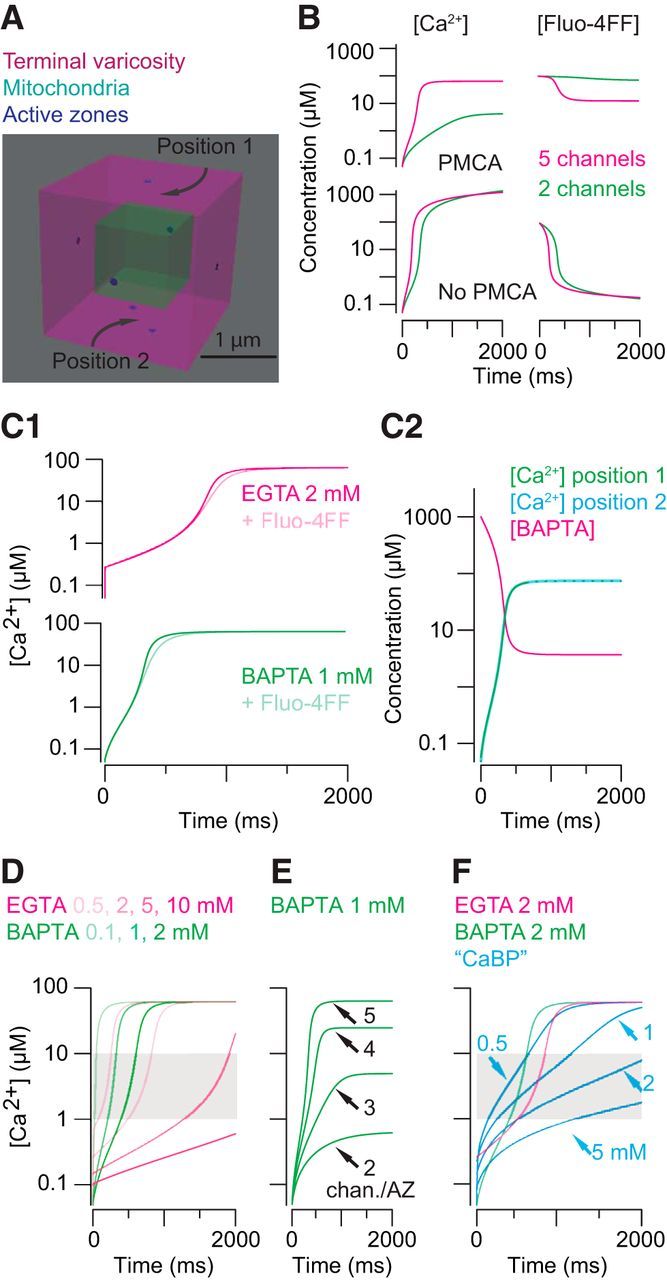
Modeling intraterminal [Ca2+]. A, An RB terminal varicosity represented as a cube with volume = 8 μm3. The mitochondria occupy 12% of the total volume. Seven ribbon-type active zones are represented as point sources for Ca2+; Ca2+ influx at each point source corresponded to the opening of two to five Ca channels. B, Global [Ca2+] and [BAPTA] measured with and without an extrusion mechanism present in the model. The rate of extrusion was adjusted to give a severalfold difference between conditions with few or more open Ca channels. C1, Including Fluo-4FF does not affect the buffering capacity of EGTA (2 mm) or BAPTA (1 mm; Fig. 5). C2, Ca2+ influx (5 channels per AZ) saturates 1 mm BAPTA. The change in [Ca2+] is the same when measured at a surface 250 nm from one AZ and at a surface equidistant from two AZs spaced 500 nm apart. D, For a range of [exogenous buffers], Ca2+ influx through five channels per AZ is sufficient to drive [Ca2+] to 1–10 μm in <1 s. E, Increasing the number of channels per AZ increases the steady-state [Ca2+]. F, For a range of [physiological buffer], Ca2+ influx through five channels per AZ is sufficient to drive [Ca2+] to 1–10 μm in <1 s. Simulated [Ca2+] with 2 mm EGTA or BAPTA present are overlaid to illustrate that buffer capacity (1 mm physiological buffer = 2 mm EGTA or BAPTA) rather than buffer kinetics determines the time course of the global change in [Ca2+].