
Figure 1.
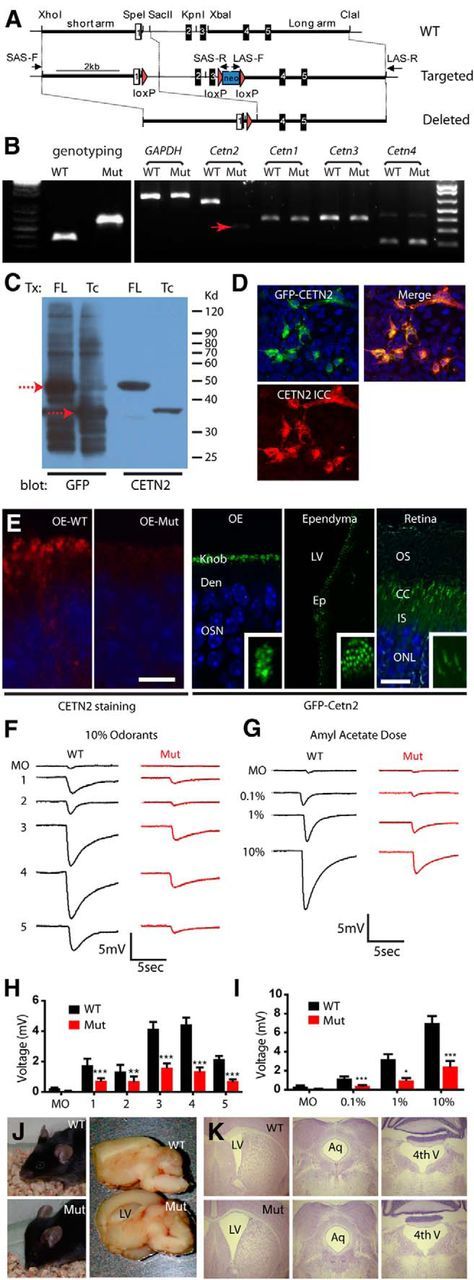
Generation of Cetn2ΔEx2,3 mice manifesting the phenotype of dysosmia and hydrocephalus. A, Schematic of gene targeting strategy. B, PCR genotyping of Cetn2ΔEx2,3 mouse (357 bp for WT, 593 bp for mutant) and RT-PCR examination of Cetn1–4 mRNA expression in OE. GAPDH was used as an internal control. Red arrow marks the faint band of truncated Cetn2ΔEx2,3 mRNA. C, Immunoblot detection of full-length (FL) GFP-CETN2 and truncated (Tc) GFP-CETN2 (red dashed arrows, 48 and 37 kDa, respectively) overexpressed in HEK-293 cells. Blots were probed with GFP antibody (left two lanes) and or CETN2 antibody (right two lanes). D, Immunofluorescence of truncated GFP-CETN2 in transfected HEK-293 cells. Endogenous GFP signal (green), with nuclear DAPI signal (blue) are shown; CETN2 antibody labeling, red (left, bottom); and merged view (right). E, CETN2 immunofluorescence of WT and mutant OE (left two panels), and expression of transgenic GFP-CETN2 in OE, ependyma, and retina photoreceptors (right three panels with insets). Den, Dendrite; LV, lateral ventricle; EP, ependyma; OS, outer segment; CC, connecting cilium; IS, inner segment; ONL, outer nuclear layer. Scale bar, 5 μm. F, G, Representative EOG responses to various odors (F) and dose-dependent test of amyl acetate (G). MO, Mineral oil; 1, citral; 2, S-butanol; 3, acetophenone; 4, cineole; 5, R-carvone. H, I, Quantification of EOG results showing reduced voltage responses to tested odors (H) and at every amyl acetate concentration (I). Error bars indicate mean ± SD (n = 7 WT, n = 9 mutants, two-way ANOVA, *p < 0.05, **p < 0.01, ***p < 0.001). J, Severe hydrocephalus of P30 Cetn2 mutant mouse, showing dome-shaped head and dilated lateral ventricle of brain. K, Mild hydrocephalus of Cetn2 mutant mouse, showing dilation of lateral ventricle (LV) but not of aqueduct (Aq) or fourth ventricle (4th V).