Figure 7.
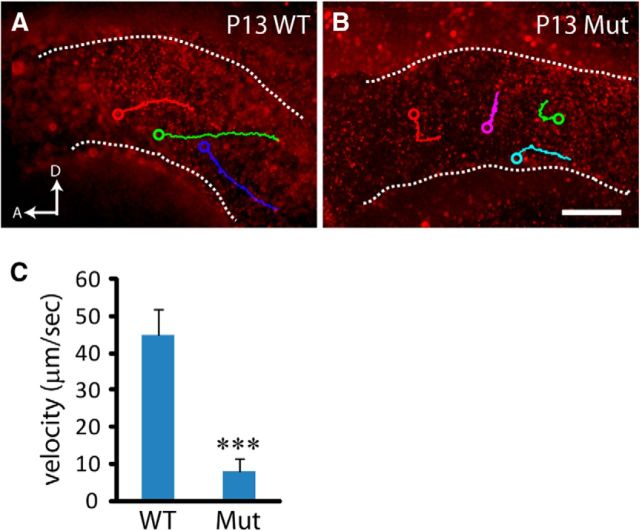
Impaired CSF flow in Cetn2 mutant mouse. A, B, Traces of latex bead movement along lateral ventricle surface (delimited by dashed white lines). Colored lines indicate the trajectory of several tracked particles, and circles mark the end of tracking. D, Dorsal; A, anterior. C, Latex microbeads moved significantly slower in Cetn2 mutant mouse (8 μm/s) than in WT (45 μm/s). Data shown as mean ± SD (>20 beads from 2 animals of each group, one-way ANOVA, ***p < 0.001). Scale bar, 20 μm.

