
FIG. 8.
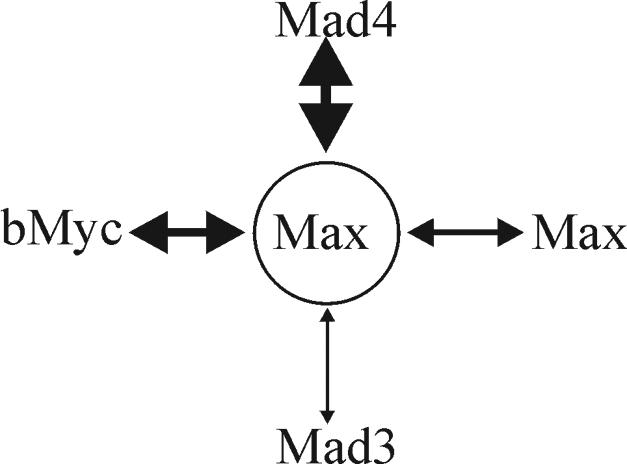
Schematic diagram representing the relative efficiencies of Max dimerization with Mad4, bMyc, Max, and Mad3 in living cells. The thickness of the double-headed arrow connecting each pair of proteins indicates their relative efficiency of complex formation.