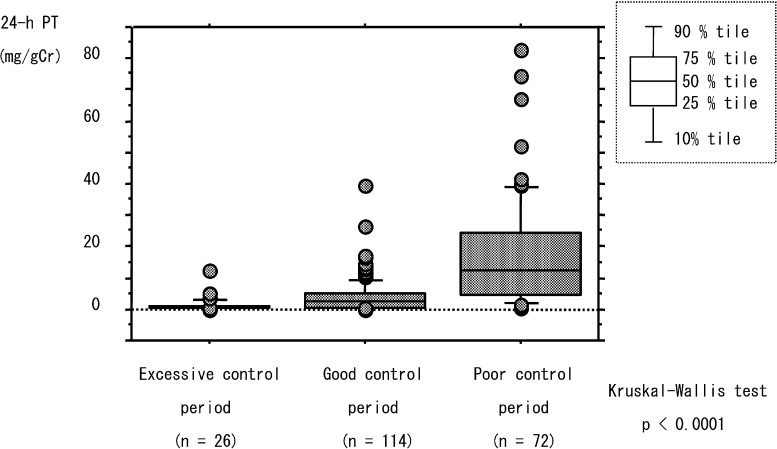
Fig. 1.
24-h PT levels in the 3 control periods. The 24-h PT levels were distributed in the ranges of 0.08–12.6, 0.02–39.71 and 0.27–82.93 mg/gCr in the excessive, good and poor control periods, respectively. Comparisons between the ranges of the 3 periods were performed using the Kruskal-Wallis test.

