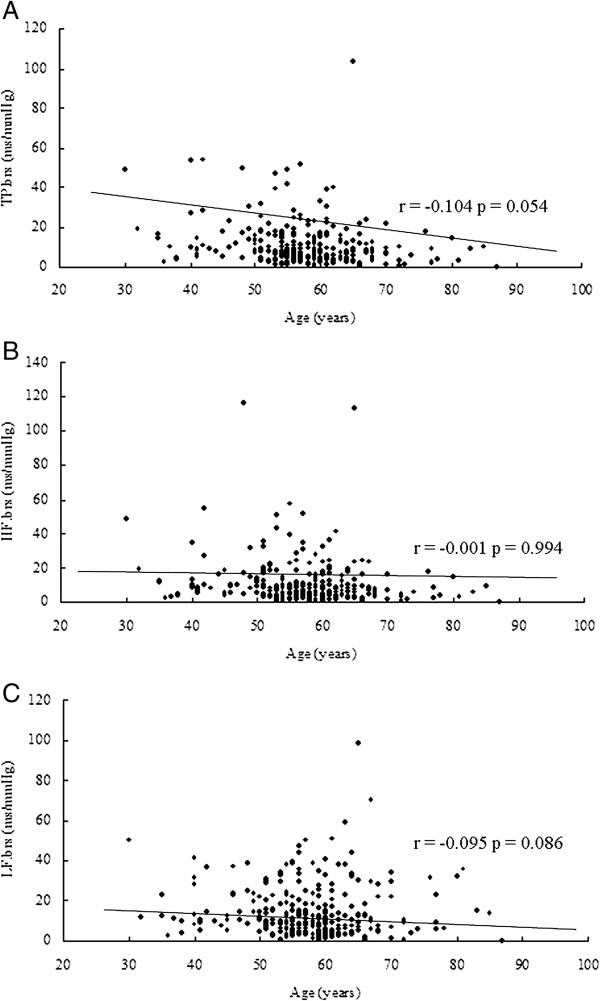
Figure 1.
Results of correlation analysis between age and parameters of baroreflex sensitivity. Correlation analysis between (A) age and total power (TP.brs; r = −0.104, P =0.054), (B) age and high frequency (HF.brs; r = −0.001, P =0.994) and (C) age and low frequency (LF.brs; r = −0.095, P =0.086).

